Market Zone Analyzer[BullByte]Understanding the Market Zone Analyzer
---
1. Purpose of the Indicator
The Market Zone Analyzer is a Pine Script™ (version 6) indicator designed to streamline market analysis on TradingView. Rather than scanning multiple separate tools, it unifies four core dimensions—trend strength, momentum, price action, and market activity—into a single, consolidated view. By doing so, it helps traders:
• Save time by avoiding manual cross-referencing of disparate signals.
• Reduce decision-making errors that can arise from juggling multiple indicators.
• Gain a clear, reliable read on whether the market is in a bullish, bearish, or sideways phase, so they can more confidently decide to enter, exit, or hold a position.
---
2. Why a Trader Should Use It
• Unified View: Combines all essential market dimensions into one easy-to-read score and dashboard, eliminating the need to piece together signals manually.
• Adaptability: Automatically adjusts its internal weighting for trend, momentum, and price action based on current volatility. Whether markets are choppy or calm, the indicator remains relevant.
• Ease of Interpretation: Outputs a simple “BULLISH,” “BEARISH,” or “SIDEWAYS” label, supplemented by an intuitive on-chart dashboard and an oscillator plot that visually highlights market direction.
• Reliability Features: Built-in smoothing of the net score and hysteresis logic (requiring consecutive confirmations before flips) minimize false signals during noisy or range-bound phases.
---
3. Why These Specific Indicators?
This script relies on a curated set of well-established technical tools, each chosen for its particular strength in measuring one of the four core dimensions:
1. Trend Strength:
• ADX/DMI (Average Directional Index / Directional Movement Index): Measures how strong a trend is, and whether the +DI line is above the –DI line (bullish) or vice versa (bearish).
• Moving Average Slope (Fast MA vs. Slow MA): Compares a shorter-period SMA to a longer-period SMA; if the fast MA sits above the slow MA, it confirms an uptrend, and vice versa for a downtrend.
• Ichimoku Cloud Differential (Senkou A vs. Senkou B): Provides a forward-looking view of trend direction; Senkou A above Senkou B signals bullishness, and the opposite signals bearishness.
2. Momentum:
• Relative Strength Index (RSI): Identifies overbought (above its dynamically calculated upper bound) or oversold (below its lower bound) conditions; changes in RSI often precede price reversals.
• Stochastic %K: Highlights shifts in short-term momentum by comparing closing price to the recent high/low range; values above its upper band signal bullish momentum, below its lower band signal bearish momentum.
• MACD Histogram: Measures the difference between the MACD line and its signal line; a positive histogram indicates upward momentum, a negative histogram indicates downward momentum.
3. Price Action:
• Highest High / Lowest Low (HH/LL) Range: Over a defined lookback period, this captures breakout or breakdown levels. A closing price near the recent highs (with a positive MA slope) yields a bullish score, and near the lows (with a negative MA slope) yields a bearish score.
• Heikin-Ashi Doji Detection: Uses Heikin-Ashi candles to identify indecision or continuation patterns. A small Heikin-Ashi body (doji) relative to recent volatility is scored as neutral; a larger body in the direction of the MA slope is scored bullish or bearish.
• Candle Range Measurement: Compares each candle’s high-low range against its own dynamic band (average range ± standard deviation). Large candles aligning with the prevailing trend score bullish or bearish accordingly; unusually small candles can indicate exhaustion or consolidation.
4. Market Activity:
• Bollinger Bands Width (BBW): Measures the distance between BB upper and lower bands; wide bands indicate high volatility, narrow bands indicate low volatility.
• Average True Range (ATR): Quantifies average price movement (volatility). A sudden spike in ATR suggests a volatile environment, while a contraction suggests calm.
• Keltner Channels Width (KCW): Similar to BBW but uses ATR around an EMA. Provides a second layer of volatility context, confirming or contrasting BBW readings.
• Volume (with Moving Average): Compares current volume to its moving average ± standard deviation. High volume validates strong moves; low volume signals potential lack of conviction.
By combining these tools, the indicator captures trend direction, momentum strength, price-action nuances, and overall market energy, yielding a more balanced and comprehensive assessment than any single tool alone.
---
4. What Makes This Indicator Stand Out
• Multi-Dimensional Analysis: Rather than relying on a lone oscillator or moving average crossover, it simultaneously evaluates trend, momentum, price action, and activity.
• Dynamic Weighting: The relative importance of trend, momentum, and price action adjusts automatically based on real-time volatility (Market Activity State). For example, in highly volatile conditions, trend and momentum signals carry more weight; in calm markets, price action signals are prioritized.
• Stability Mechanisms:
• Smoothing: The net score is passed through a short moving average, filtering out noise, especially on lower timeframes.
• Hysteresis: Both Market Activity State and the final bullish/bearish/sideways zone require two consecutive confirmations before flipping, reducing whipsaw.
• Visual Interpretation: A fully customizable on-chart dashboard displays each sub-indicator’s value, regime, score, and comment, all color-coded. The oscillator plot changes color to reflect the current market zone (green for bullish, red for bearish, gray for sideways) and shows horizontal threshold lines at +2, 0, and –2.
---
5. Recommended Timeframes
• Short-Term (5 min, 15 min): Day traders and scalpers can benefit from rapid signals, but should enable smoothing (and possibly disable hysteresis) to reduce false whipsaws.
• Medium-Term (1 h, 4 h): Swing traders find a balance between responsiveness and reliability. Less smoothing is required here, and the default parameters (e.g., ADX length = 14, RSI length = 14) perform well.
• Long-Term (Daily, Weekly): Position traders tracking major trends can disable smoothing for immediate raw readings, since higher-timeframe noise is minimal. Adjust lookback lengths (e.g., increase adxLength, rsiLength) if desired for slower signals.
Tip: If you keep smoothing off, stick to timeframes of 1 h or higher to avoid excessive signal “chatter.”
---
6. How Scoring Works
A. Individual Indicator Scores
Each sub-indicator is assigned one of three discrete scores:
• +1 if it indicates a bullish condition (e.g., RSI above its dynamically calculated upper bound).
• 0 if it is neutral (e.g., RSI between upper and lower bounds).
• –1 if it indicates a bearish condition (e.g., RSI below its dynamically calculated lower bound).
Examples of individual score assignments:
• ADX/DMI:
• +1 if ADX ≥ adxThreshold and +DI > –DI (strong bullish trend)
• –1 if ADX ≥ adxThreshold and –DI > +DI (strong bearish trend)
• 0 if ADX < adxThreshold (trend strength below threshold)
• RSI:
• +1 if RSI > RSI_upperBound
• –1 if RSI < RSI_lowerBound
• 0 otherwise
• ATR (as part of Market Activity):
• +1 if ATR > (ATR_MA + stdev(ATR))
• –1 if ATR < (ATR_MA – stdev(ATR))
• 0 otherwise
Each of the four main categories shares this same +1/0/–1 logic across their sub-components.
B. Category Scores
Once each sub-indicator reports +1, 0, or –1, these are summed within their categories as follows:
• Trend Score = (ADX score) + (MA slope score) + (Ichimoku differential score)
• Momentum Score = (RSI score) + (Stochastic %K score) + (MACD histogram score)
• Price Action Score = (Highest-High/Lowest-Low score) + (Heikin-Ashi doji score) + (Candle range score)
• Market Activity Raw Score = (BBW score) + (ATR score) + (KC width score) + (Volume score)
Each category’s summed value can range between –3 and +3 (for Trend, Momentum, and Price Action), and between –4 and +4 for Market Activity raw.
C. Market Activity State and Dynamic Weight Adjustments
Rather than contributing directly to the netScore like the other three categories, Market Activity determines how much weight to assign to Trend, Momentum, and Price Action:
1. Compute Market Activity Raw Score by summing BBW, ATR, KCW, and Volume individual scores (each +1/0/–1).
2. Bucket into High, Medium, or Low Activity:
• High if raw Score ≥ 2 (volatile market).
• Low if raw Score ≤ –2 (calm market).
• Medium otherwise.
3. Apply Hysteresis (if enabled): The state only flips after two consecutive bars register the same high/low/medium label.
4. Set Category Weights:
• High Activity: Trend = 50 %, Momentum = 35 %, Price Action = 15 %.
• Low Activity: Trend = 25 %, Momentum = 20 %, Price Action = 55 %.
• Medium Activity: Use the trader’s base weight inputs (e.g., Trend = 40 %, Momentum = 30 %, Price Action = 30 % by default).
D. Calculating the Net Score
5. Normalize Base Weights (so that the sum of Trend + Momentum + Price Action always equals 100 %).
6. Determine Current Weights based on the Market Activity State (High/Medium/Low).
7. Compute Each Category’s Contribution: Multiply (categoryScore) × (currentWeight).
8. Sum Contributions to get the raw netScore (a floating-point value that can exceed ±3 when scores are strong).
9. Smooth the netScore over two bars (if smoothing is enabled) to reduce noise.
10. Apply Hysteresis to the Final Zone:
• If the smoothed netScore ≥ +2, the bar is classified as “Bullish.”
• If the smoothed netScore ≤ –2, the bar is classified as “Bearish.”
• Otherwise, it is “Sideways.”
• To prevent rapid flips, the script requires two consecutive bars in the new zone before officially changing the displayed zone (if hysteresis is on).
E. Thresholds for Zone Classification
• BULLISH: netScore ≥ +2
• BEARISH: netScore ≤ –2
• SIDEWAYS: –2 < netScore < +2
---
7. Role of Volatility (Market Activity State) in Scoring
Volatility acts as a dynamic switch that shifts which category carries the most influence:
1. High Activity (Volatile):
• Detected when at least two sub-scores out of BBW, ATR, KCW, and Volume equal +1.
• The script sets Trend weight = 50 % and Momentum weight = 35 %. Price Action weight is minimized at 15 %.
• Rationale: In volatile markets, strong trending moves and momentum surges dominate, so those signals are more reliable than nuanced candle patterns.
2. Low Activity (Calm):
• Detected when at least two sub-scores out of BBW, ATR, KCW, and Volume equal –1.
• The script sets Price Action weight = 55 %, Trend = 25 %, and Momentum = 20 %.
• Rationale: In quiet, sideways markets, subtle price-action signals (breakouts, doji patterns, small-range candles) are often the best early indicators of a new move.
3. Medium Activity (Balanced):
• Raw Score between –1 and +1 from the four volatility metrics.
• Uses whatever base weights the trader has specified (e.g., Trend = 40 %, Momentum = 30 %, Price Action = 30 %).
Because volatility can fluctuate rapidly, the script employs hysteresis on Market Activity State: a new High or Low state must occur on two consecutive bars before weights actually shift. This avoids constant back-and-forth weight changes and provides more stability.
---
8. Scoring Example (Hypothetical Scenario)
• Symbol: Bitcoin on a 1-hour chart.
• Market Activity: Raw volatility sub-scores show BBW (+1), ATR (+1), KCW (0), Volume (+1) → Total raw Score = +3 → High Activity.
• Weights Selected: Trend = 50 %, Momentum = 35 %, Price Action = 15 %.
• Trend Signals:
• ADX strong and +DI > –DI → +1
• Fast MA above Slow MA → +1
• Ichimoku Senkou A > Senkou B → +1
→ Trend Score = +3
• Momentum Signals:
• RSI above upper bound → +1
• MACD histogram positive → +1
• Stochastic %K within neutral zone → 0
→ Momentum Score = +2
• Price Action Signals:
• Highest High/Lowest Low check yields 0 (close not near extremes)
• Heikin-Ashi doji reading is neutral → 0
• Candle range slightly above upper bound but trend is strong, so → +1
→ Price Action Score = +1
• Compute Net Score (before smoothing):
• Trend contribution = 3 × 0.50 = 1.50
• Momentum contribution = 2 × 0.35 = 0.70
• Price Action contribution = 1 × 0.15 = 0.15
• Raw netScore = 1.50 + 0.70 + 0.15 = 2.35
• Since 2.35 ≥ +2 and hysteresis is met, the final zone is “Bullish.”
Although the netScore lands at 2.35 (Bullish), smoothing might bring it slightly below 2.00 on the first bar (e.g., 1.90), in which case the script would wait for a second consecutive reading above +2 before officially classifying the zone as Bullish (if hysteresis is enabled).
---
9. Correlation Between Categories
The four categories—Trend Strength, Momentum, Price Action, and Market Activity—often reinforce or offset one another. The script takes advantage of these natural correlations:
• Bullish Alignment: If ADX is strong and pointed upward, fast MA is above slow MA, and Ichimoku is positive, that usually coincides with RSI climbing above its upper bound and the MACD histogram turning positive. In such cases, both Trend and Momentum categories generate +1 or +2. Because the Market Activity State is likely High (given the accompanying volatility), Trend and Momentum weights are at their peak, so the netScore quickly crosses into Bullish territory.
• Sideways/Consolidation: During a low-volatility, sideways phase, ADX may fall below its threshold, MAs may flatten, and RSI might hover in the neutral band. However, subtle price-action signals (like a small breakout candle or a Heikin-Ashi candle with a slight bias) can still produce a +1 in the Price Action category. If Market Activity is Low, Price Action’s weight (55 %) can carry enough influence—even if Trend and Momentum are neutral—to push the netScore out of “Sideways” into a mild bullish or bearish bias.
• Opposing Signals: When Trend is bullish but Momentum turns negative (for example, price continues up but RSI rolls over), the two scores can partially cancel. Market Activity may remain Medium, in which case the netScore lingers near zero (Sideways). The trader can then wait for either a clearer momentum shift or a fresh price-action breakout before committing.
By dynamically recognizing these correlations and adjusting weights, the indicator ensures that:
• When Trend and Momentum align (and volatility supports it), the netScore leaps strongly into Bullish or Bearish.
• When Trend is neutral but Price Action shows an early move in a low-volatility environment, Price Action’s extra weight in the Low Activity State can still produce actionable signals.
---
10. Market Activity State & Its Role (Detailed)
The Market Activity State is not a direct category score—it is an overarching context setter for how heavily to trust Trend, Momentum, or Price Action. Here’s how it is derived and applied:
1. Calculate Four Volatility Sub-Scores:
• BBW: Compare the current band width to its own moving average ± standard deviation. If BBW > (BBW_MA + stdev), assign +1 (high volatility); if BBW < (BBW_MA × 0.5), assign –1 (low volatility); else 0.
• ATR: Compare ATR to its moving average ± standard deviation. A spike above the upper threshold is +1; a contraction below the lower threshold is –1; otherwise 0.
• KCW: Same logic as ATR but around the KCW mean.
• Volume: Compare current volume to its volume MA ± standard deviation. Above the upper threshold is +1; below the lower threshold is –1; else 0.
2. Sum Sub-Scores → Raw Market Activity Score: Range between –4 and +4.
3. Assign Market Activity State:
• High Activity: Raw Score ≥ +2 (at least two volatility metrics are strongly spiking).
• Low Activity: Raw Score ≤ –2 (at least two metrics signal unusually low volatility or thin volume).
• Medium Activity: Raw Score is between –1 and +1 inclusive.
4. Hysteresis for Stability:
• If hysteresis is enabled, a new state only takes hold after two consecutive bars confirm the same High, Medium, or Low label.
• This prevents the Market Activity State from bouncing around when volatility is on the fence.
5. Set Category Weights Based on Activity State:
• High Activity: Trend = 50 %, Momentum = 35 %, Price Action = 15 %.
• Low Activity: Trend = 25 %, Momentum = 20 %, Price Action = 55 %.
• Medium Activity: Use trader’s base weights (e.g., Trend = 40 %, Momentum = 30 %, Price Action = 30 %).
6. Impact on netScore: Because category scores (–3 to +3) multiply by these weights, High Activity amplifies the effect of strong Trend and Momentum scores; Low Activity amplifies the effect of Price Action.
7. Market Context Tooltip: The dashboard includes a tooltip summarizing the current state—e.g., “High activity, trend and momentum prioritized,” “Low activity, price action prioritized,” or “Balanced market, all categories considered.”
---
11. Category Weights: Base vs. Dynamic
Traders begin by specifying base weights for Trend Strength, Momentum, and Price Action that sum to 100 %. These apply only when volatility is in the Medium band. Once volatility shifts:
• High Volatility Overrides:
• Trend jumps from its base (e.g., 40 %) to 50 %.
• Momentum jumps from its base (e.g., 30 %) to 35 %.
• Price Action is reduced to 15 %.
Example: If base weights were Trend = 40 %, Momentum = 30 %, Price Action = 30 %, then in High Activity they become 50/35/15. A Trend score of +3 now contributes 3 × 0.50 = +1.50 to netScore; a Momentum +2 contributes 2 × 0.35 = +0.70. In total, Trend + Momentum can easily push netScore above the +2 threshold on its own.
• Low Volatility Overrides:
• Price Action leaps from its base (30 %) to 55 %.
• Trend falls to 25 %, Momentum falls to 20 %.
Why? When markets are quiet, subtle candle breakouts, doji patterns, and small-range expansions tend to foreshadow the next swing more effectively than raw trend readings. A Price Action score of +3 in this state contributes 3 × 0.55 = +1.65, which can carry the netScore toward +2—even if Trend and Momentum are neutral or only mildly positive.
Because these weight shifts happen only after two consecutive bars confirm a High or Low state (if hysteresis is on), the indicator avoids constantly flipping its emphasis during borderline volatility phases.
---
12. Dominant Category Explained
Within the dashboard, a label such as “Trend Dominant,” “Momentum Dominant,” or “Price Action Dominant” appears when one category’s absolute weighted contribution to netScore is the largest. Concretely:
• Compute each category’s weighted contribution = (raw category score) × (current weight).
• Compare the absolute values of those three contributions.
• The category with the highest absolute value is flagged as Dominant for that bar.
Why It Matters:
• Momentum Dominant: Indicates that the combined force of RSI, Stochastic, and MACD (after weighting) is pushing netScore farther than either Trend or Price Action. In practice, it means that short-term sentiment and speed of change are the primary drivers right now, so traders should watch for continued momentum signals before committing to a trade.
• Trend Dominant: Means ADX, MA slope, and Ichimoku (once weighted) outweigh the other categories. This suggests a strong directional move is in place; trend-following entries or confirming pullbacks are likely to succeed.
• Price Action Dominant: Occurs when breakout/breakdown patterns, Heikin-Ashi candle readings, and range expansions (after weighting) are the most influential. This often happens in calmer markets, where subtle shifts in candle structure can foreshadow bigger moves.
By explicitly calling out which category is carrying the most weight at any moment, the dashboard gives traders immediate insight into why the netScore is tilting toward bullish, bearish, or sideways.
---
13. Oscillator Plot: How to Read It
The “Net Score” oscillator sits below the dashboard and visually displays the smoothed netScore as a line graph. Key features:
1. Value Range: In normal conditions it oscillates roughly between –3 and +3, but extreme confluences can push it outside that range.
2. Horizontal Threshold Lines:
• +2 Line (Bullish threshold)
• 0 Line (Neutral midline)
• –2 Line (Bearish threshold)
3. Zone Coloring:
• Green Background (Bullish Zone): When netScore ≥ +2.
• Red Background (Bearish Zone): When netScore ≤ –2.
• Gray Background (Sideways Zone): When –2 < netScore < +2.
4. Dynamic Line Color:
• The plotted netScore line itself is colored green in a Bullish Zone, red in a Bearish Zone, or gray in a Sideways Zone, creating an immediate visual cue.
Interpretation Tips:
• Crossing Above +2: Signals a strong enough combined trend/momentum/price-action reading to classify as Bullish. Many traders wait for a clear crossing plus a confirmation candle before entering a long position.
• Crossing Below –2: Indicates a strong Bearish signal. Traders may consider short or exit strategies.
• Rising Slope, Even Below +2: If netScore climbs steadily from neutral toward +2, it demonstrates building bullish momentum.
• Divergence: If price makes a higher high but the oscillator fails to reach a new high, it can warn of weakening momentum and a potential reversal.
---
14. Comments and Their Necessity
Every sub-indicator (ADX, MA slope, Ichimoku, RSI, Stochastic, MACD, HH/LL, Heikin-Ashi, Candle Range, BBW, ATR, KCW, Volume) generates a short comment that appears in the detailed dashboard. Examples:
• “Strong bullish trend” or “Strong bearish trend” for ADX/DMI
• “Fast MA above slow MA” or “Fast MA below slow MA” for MA slope
• “RSI above dynamic threshold” or “RSI below dynamic threshold” for RSI
• “MACD histogram positive” or “MACD histogram negative” for MACD Hist
• “Price near highs” or “Price near lows” for HH/LL checks
• “Bullish Heikin Ashi” or “Bearish Heikin Ashi” for HA Doji scoring
• “Large range, trend confirmed” or “Small range, trend contradicted” for Candle Range
Additionally, the top-row comment for each category is:
• Trend: “Highly Bullish,” “Highly Bearish,” or “Neutral Trend.”
• Momentum: “Strong Momentum,” “Weak Momentum,” or “Neutral Momentum.”
• Price Action: “Bullish Action,” “Bearish Action,” or “Neutral Action.”
• Market Activity: “Volatile Market,” “Calm Market,” or “Stable Market.”
Reasons for These Comments:
• Transparency: Shows exactly how each sub-indicator contributed to its category score.
• Education: Helps traders learn why a category is labeled bullish, bearish, or neutral, building intuition over time.
• Customization: If, for example, the RSI comment says “RSI neutral” despite an impending trend shift, a trader might choose to adjust RSI length or thresholds.
In the detailed dashboard, hovering over each comment cell also reveals a tooltip with additional context (e.g., “Fast MA above slow MA” or “Senkou A above Senkou B”), helping traders understand the precise rule behind that +1, 0, or –1 assignment.
---
15. Real-Life Example (Consolidated)
• Instrument & Timeframe: Bitcoin (BTCUSD), 1-hour chart.
• Current Market Activity: BBW and ATR both spike (+1 each), KCW is moderately high (+1), but volume is only neutral (0) → Raw Market Activity Score = +2 → State = High Activity (after two bars, if hysteresis is on).
• Category Weights Applied: Trend = 50 %, Momentum = 35 %, Price Action = 15 %.
• Trend Sub-Scores:
1. ADX = 25 (above threshold 20) with +DI > –DI → +1.
2. Fast MA (20-period) sits above Slow MA (50-period) → +1.
3. Ichimoku: Senkou A > Senkou B → +1.
→ Trend Score = +3.
• Momentum Sub-Scores:
4. RSI = 75 (above its moving average +1 stdev) → +1.
5. MACD histogram = +0.15 → +1.
6. Stochastic %K = 50 (mid-range) → 0.
→ Momentum Score = +2.
• Price Action Sub-Scores:
7. Price is not within 1 % of the 20-period high/low and slope = positive → 0.
8. Heikin-Ashi body is slightly larger than stdev over last 5 bars with haClose > haOpen → +1.
9. Candle range is just above its dynamic upper bound but trend is already captured, so → +1.
→ Price Action Score = +2.
• Calculate netScore (before smoothing):
• Trend contribution = 3 × 0.50 = 1.50
• Momentum contribution = 2 × 0.35 = 0.70
• Price Action contribution = 2 × 0.15 = 0.30
• Raw netScore = 1.50 + 0.70 + 0.30 = 2.50 → Immediately classified as Bullish.
• Oscillator & Dashboard Output:
• The oscillator line crosses above +2 and turns green.
• Dashboard displays:
• Trend Regime “BULLISH,” Trend Score = 3, Comment = “Highly Bullish.”
• Momentum Regime “BULLISH,” Momentum Score = 2, Comment = “Strong Momentum.”
• Price Action Regime “BULLISH,” Price Action Score = 2, Comment = “Bullish Action.”
• Market Activity State “High,” Comment = “Volatile Market.”
• Weights: Trend 50 %, Momentum 35 %, Price Action 15 %.
• Dominant Category: Trend (because 1.50 > 0.70 > 0.30).
• Overall Score: 2.50, posCount = (three +1s in Trend) + (two +1s in Momentum) + (two +1s in Price Action) = 7 bullish signals, negCount = 0.
• Final Zone = “BULLISH.”
• The trader sees that both Trend and Momentum are reinforcing each other under high volatility. They might wait one more candle for confirmation but already have strong evidence to consider a long.
---
• .
---
Disclaimer
This indicator is strictly a technical analysis tool and does not constitute financial advice. All trading involves risk, including potential loss of capital. Past performance is not indicative of future results. Traders should:
• Always backtest the “Market Zone Analyzer ” on their chosen symbols and timeframes before committing real capital.
• Combine this tool with sound risk management, position sizing, and, if possible, fundamental analysis.
• Understand that no indicator is foolproof; always be prepared for unexpected market moves.
Goodluck
-BullByte!
---
Cerca negli script per "relative strength"

Market Push Meter - CoffeeStyleMarket Push Meter - CoffeeKiller Indicator Guide
Welcome traders! This guide will walk you through the Market Push Meter indicator, a sophisticated volume analysis tool developed by CoffeeKiller with the help and assistance of FindBetterTrades that measures and visualizes the ongoing battle between buyers and sellers through volume pressure analysis.
🔔 **Warning: This Is Not a Standard Volume Indicator** 🔔 This indicator analyzes volume pressure in a unique way, combining directional volume with price action to identify market imbalances between buyers and sellers. All credit for the core logic for this indicator goes to FindBetterTrades and his/hers Volume Pressure Histogram (Normalized) (this is my adaptation and style added to that core logic, thus the CoffeeStyle name was added).
Core Concept: Volume Pressure Analysis
The foundation of this indicator lies in measuring the imbalance between buying and selling volume, providing insights into which market participants are exerting more pressure on price movements.
Volume Pressure Columns: Buying vs Selling Force
- Positive Green Columns: Net buying pressure
- Negative Red Columns: Net selling pressure
- Color intensity varies based on pressure strength
- Special coloring for new high/low boundaries
Marker Lines: Dynamic Support/Resistance
- High Marker Line (Magenta): Tracks the highest point reached during buying phases
- Low Marker Line (Cyan): Tracks the lowest point reached during selling phases
- Creates visual boundaries showing pressure extremes
Peak Detection System:
- Triangular markers identify significant local maxima and minima
- Background highlighting shows important pressure peaks
- Helps identify potential reversal points and pressure exhaustion
Reference Lines:
- Overbought Level: Threshold for extreme selling pressure
- Oversold Level: Threshold for extreme buying pressure
- Used to identify potential reversal zones
Core Components
1. Volume Pressure Calculation
- Separation of up-volume and down-volume
- Calculation of net volume pressure
- Smoothing for consistent visualization
- Normalization against total volume for percentage scaling
2. Boundary Tracking System
- Automatic detection of highest values in buying phases
- Automatic detection of lowest values in selling phases
- Step-line visualization of boundaries
- Color-coded for easy identification
3. Peak Detection System
- Identification of local maxima and minima
- Background highlighting of significant peaks
- Triangle markers for peak visualization
- Zero-line cross detection for trend changes
4. Threshold Settings
- Extreme threshold multiplier for identifying significant pressure
- Overbought/oversold levels for potential reversals
- Dynamic color coding based on pressure intensity
- Alert conditions for key pressure levels
Main Features
Volume Analysis Settings
- Customizable volume MA length
- Signal smoothing for clearer readings
- Optional log scale for handling wide range variations
- Adjustable threshold multiplier for sensitivity
Visual Elements
- Color-coded columns showing pressure direction and strength
- Dynamic marker lines for pressure boundaries
- Peak triangles for significant turning points
- Background highlighting for peak identification
- Overbought/oversold reference lines
Signal Generation
- Zero-line crosses for trend change signals
- Boundary breaks for pressure strength
- Peak formation for potential reversals
- Color changes for pressure direction and intensity
- Alert conditions for extreme pressure levels
Customization Options
- Volume analysis parameters
- Marker line visibility and colors
- Peak marker display options
- Log scale toggle for handling various markets
- Overbought/oversold threshold adjustments
Trading Applications
1. Trend Identification
- Volume pressure crossing above zero: buying pressure emerging
- Volume pressure crossing below zero: selling pressure emerging
- Column color: indicates pressure direction
- Column height: indicates pressure strength
- Signal line: confirms overall trend direction
2. Reversal Detection
- Peak triangles after extended trend: potential exhaustion
- Background highlighting: significant reversal points
- Volume pressure approaching marker lines: potential trend change
- Color shifts from bright to muted: decreasing pressure
- Readings beyond overbought/oversold levels: potential reversal zones
3. Pressure Analysis
- Breaking above previous high boundary: accelerating buying pressure
- Breaking below previous low boundary: accelerating selling pressure
- Special coloring (magenta/cyan): boundary breaks indicating strength
- Extreme readings: potential climactic buying/selling
4. Market Structure Assessment
- Consecutive higher peaks: strengthening buying structure
- Consecutive lower troughs: strengthening selling structure
- Peak comparisons: relative strength of pressure phases
- Boundary line steps: market structure levels
Optimization Guide
1. Volume Analysis Settings
- Volume MA Length: Default 25 provides balanced signals
- Lower values (10-15): More responsive, potentially noisier
- Higher values (30-50): Smoother, fewer false signals
- Signal Smoothing Length: Default 8 provides good balance
- Lower values: More responsive to pressure changes
- Higher values: Smoother trend identification
2. Threshold Settings
- Extreme Threshold Multiplier: Default 20.0
- Lower values: More signals, potentially more noise
- Higher values: Fewer signals, but more significant
- Overbought/Oversold Levels: Defaults at 20/-20
- Adjust based on instrument volatility
- Wider settings for more volatile instruments
3. Visual Customization
- Marker Line Colors: Adjust for visibility on your chart
- Peak Marker Color: Default yellow provides good contrast
- Enable/disable background highlights based on preference
- Consider log scale for instruments with wide volume ranges
4. Alert Settings
- Configure alerts for high buying pressure
- Configure alerts for high selling pressure
- Set additional alerts for zero-line crosses
- Consider timeframe when setting alert sensitivity
Best Practices
1. Signal Confirmation
- Wait for zero-line crosses to confirm pressure changes
- Look for peak formations to identify potential reversals
- Check for boundary breaks to confirm strong pressure
- Use with price action for entry/exit precision
- Consider extreme threshold crossings as significant signals
2. Timeframe Selection
- Lower timeframes: more signals, potential noise
- Higher timeframes: cleaner signals, less frequent
- Multiple timeframes: confirm signals across time horizons
- Match to your trading style and holding period
3. Market Context
- Strong buying phase: positive columns breaking above marker line
- Strong selling phase: negative columns breaking below marker line
- Columns approaching zero: potential pressure shift
- Columns beyond overbought/oversold: extreme conditions, potential reversal
4. Combining with Other Indicators
- Use with trend indicators for confirmation
- Pair with price action oscillators for divergence detection
- Combine with traditional volume indicators for validation
- Consider support/resistance levels with boundary lines
Advanced Trading Strategies
1. Boundary Break Strategy
- Enter long when volume pressure breaks above previous high marker line
- Enter short when volume pressure breaks below previous low marker line
- Use zero-line as initial stop-loss reference
- Take profits at formation of opposing peaks
2. Peak Trading Strategy
- Identify significant peaks with triangular markers
- Look for consecutive lower peaks in buying phases for shorting opportunities
- Look for consecutive higher troughs in selling phases for buying opportunities
- Use zero-line crosses as confirmation
3. Extreme Reading Strategy
- Look for volume pressure beyond overbought/oversold levels
- Watch for color changes and peak formations
- Enter counter-trend positions after confirmed peaks
- Use tight stops due to extreme market conditions
4. Volume Color Strategy
- Enter long when columns turn bright green (increasing buying pressure)
- Enter short when columns turn bright red (increasing selling pressure)
- Exit when color intensity fades (decreasing pressure)
- Use marker lines as dynamic support/resistance
Practical Analysis Examples
Bullish Market Scenario
- Volume pressure crosses above zero line
- Green columns grow in height and intensity
- High marker line forms steps upward
- Peak triangles appear at local maxima
- Background highlights appear at significant buying pressure peaks
Bearish Market Scenario
- Volume pressure crosses below zero line
- Red columns grow in depth and intensity
- Low marker line forms steps downward
- Peak triangles appear at local minima
- Background highlights appear at significant selling pressure troughs
Consolidation Scenario
- Volume pressure oscillates around zero line
- Column colors alternate frequently
- Marker lines remain relatively flat
- Few or no new peak highlights appear
- Pressure values remain small
Understanding Market Dynamics Through Market Push Meter
At its core, this indicator provides a unique lens to visualize market pressure through volume analysis:
1. Volume Imbalance: By separating and comparing buying volume (up candles) from selling volume (down candles), the indicator provides insights into which side is exerting more pressure in the market.
2. Normalized Pressure: The indicator normalizes volume pressure as a percentage of total volume, making it more comparable across different market conditions and instruments.
3. Dynamic Boundaries: The marker lines create a visual representation of the "high water marks" of pressure in both directions, helping to identify when markets are making new pressure extremes.
4. Exhaustion Signals: The peak detection system highlights moments where pressure has reached a local maximum or minimum, often precursors to reversals or consolidations.
Remember:
- Combine signals from volume pressure, marker lines, and peak formations
- Use appropriate timeframe settings for your trading style
- Customize the indicator to match your visual preferences and market
- Consider overall market conditions and correlate with price action
This indicator works best when:
- Used as part of a comprehensive trading system
- Combined with proper risk management
- Applied with an understanding of current market conditions
- Signals are confirmed by price action and other indicators
DISCLAIMER: This indicator and its signals are intended solely for educational and informational purposes. They do not constitute financial advice. Trading involves significant risk of loss. Always conduct your own analysis and consult with financial professionals before making trading decisions.

ZenAlgo - QZenAlgo - Q
Description
ZenAlgo - Q is an oscillator based on the QQE (Quantitative Qualitative Estimation) method. This version incorporates refinements for additional visualization and interpretation options. It is designed to help traders observe momentum changes and divergence patterns in price movements.
Key Features
QQE-Based Calculation : Derived from the open-source QQE script by Glaz (Metastock Version of QQE), with modifications for alternative visualization.
Dual RSI-Based Analysis : Uses two RSI calculations to provide additional context on price movements.
Adaptive Trend Bands : Adjust dynamically based on the market conditions.
Divergence Identification : Highlights potential differences between price action and oscillator movement.
Dynamic Color Coding : Displays histogram bars to illustrate shifts in oscillator values.
Configurable Alerts : Enables notifications for specific oscillator conditions.
How It Works
The indicator calculates a smoothed RSI-based oscillator that tracks the relative strength of price movement. It applies an exponential moving average (EMA) smoothing to reduce noise while maintaining responsiveness.
Two adaptive bands are calculated using a variation of the QQE method, which helps define dynamic overbought and oversold conditions.
The histogram bars shift in color based on the position of the oscillator relative to the bands. Lighter shades indicate weaker momentum, while stronger momentum is represented by more saturated colors.
The script also includes a secondary RSI component, which provides an additional layer of analysis. This secondary RSI helps refine momentum trends by smoothing out short-term fluctuations.
Divergence identification is built-in, highlighting where price action deviates from oscillator readings. Bullish divergence occurs when price forms a lower low while the oscillator forms a higher low, and bearish divergence is identified when price forms a higher high while the oscillator forms a lower high.
The indicator does not generate buy or sell signals but instead provides contextual information that can be used alongside other trading strategies.
Use Cases
Trend Observation : Traders can use the histogram to observe whether momentum is strengthening or weakening over time. A shift in color can indicate a potential change in trend strength.
Divergence Analysis : By comparing oscillator divergence with price movement, traders can identify situations where price action may be losing momentum. Divergences do not guarantee reversals but can serve as an early warning to re-evaluate positions.
Momentum Tracking : The dual RSI structure allows users to monitor both short-term and long-term momentum. When both RSI components are aligned, it suggests a more stable trend, while divergence between them may indicate potential consolidation or trend shifts.
Supplementary Analysis : This indicator is best used as a supporting tool alongside volume-based or trend-following indicators. It helps visualize underlying price behavior but should not be used in isolation for decision-making.
Market Context Interpretation : The combination of adaptive bands and histogram visualization allows traders to assess how recent price action compares to historical movement, helping to place current conditions in a broader market context.
Attribution
This script is an adaptation of the open-source QQE script originally developed by Glaz. We acknowledge and appreciate the original author's work, which served as a foundation for our modifications.
Disclaimer
This indicator is intended for informational purposes only. It should not be interpreted as financial advice. Always conduct independent research and risk management before making trading decisions.

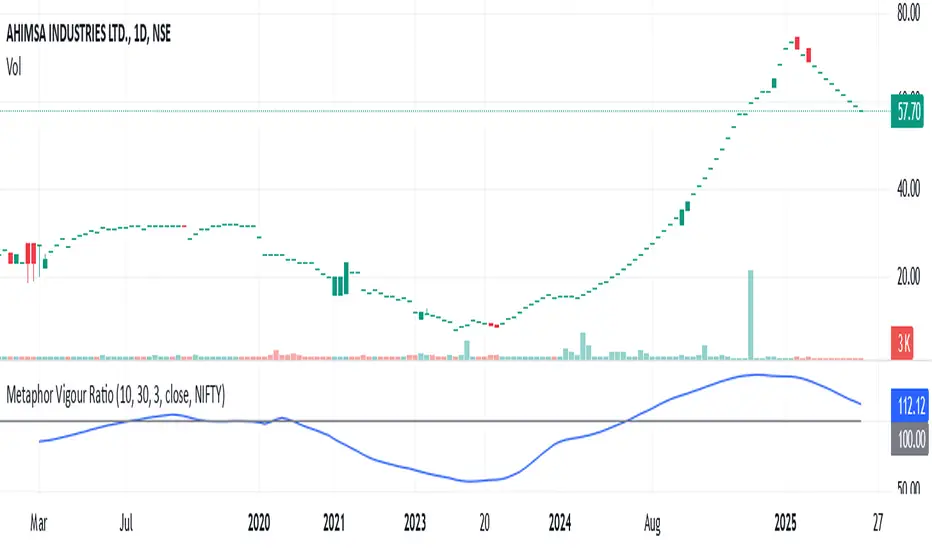
Metaphor Vigour Ratio### **Script Name:** Metaphor Vigour Ratio
**Short Title:** Metaphor Vigour Ratio
**Author:** Sovit Manjani, CMT
**Description:**
The Metaphor Vigour Ratio (MVRatio) is a powerful Relative Strength Indicator designed for assessing normalized relative strength. It is versatile and can be applied to any script or used to rank symbols based on their intermarket relative strength.
---
### **Features:**
1. **Bullish and Bearish Signals:**
- **Above 100:** Indicates a bullish trend.
- **Below 100:** Indicates a bearish trend.
2. **Trend Analysis with Slope:**
- **Slope Rising:** Suggests bullish momentum.
- **Slope Falling:** Suggests bearish momentum.
3. **Stock Selection Strategy:**
- Identify and rank stocks based on the MVRatio. For example, buy the top 10 stocks of Nifty with the highest MVRatio values for strong performance potential.
---
### **Inputs:**
1. **Fast EMA Period (RSEMAFast):** Default set to 10. Controls the sensitivity of the Fast Moving Average.
2. **Slow EMA Period (RSEMASlow):** Default set to 30. Provides a stable trend base with the Slow Moving Average.
3. **Smooth EMA Period (SmoothEMA):** Default set to 3. Smooths the MVRatio for better clarity.
4. **Close Source:** Default is the closing price, but it can be customized as needed.
5. **Comparative Symbol (ComparativeTickerId):** Default is "NSE:NIFTY," allowing comparison against a benchmark index.
---
### **Calculation Logic:**
1. **Relative Strength (RS):**
- Calculated as the ratio of the base symbol's price to the comparative symbol's price.
2. **Exponential Moving Averages (FastMA and SlowMA):**
- Applied to the RS to smooth and differentiate trends.
3. **Metaphor Vigour Ratio (MVRatio):**
- Computed as the ratio of FastMA to SlowMA, scaled by 100, and further smoothed using SmoothEMA.
---
### **Visualization:**
1. **MVRatio Plot (Blue):**
- Represents the relative strength dynamics.
2. **Reference Line at 100 (Gray):**
- Helps quickly identify bullish (above 100) and bearish (below 100) zones.
---
### **How to Use:**
1. Add the indicator to your chart from TradingView's Pine Script editor.
2. Compare the performance of any symbol relative to a benchmark (e.g., Nifty).
3. Analyze trends, slopes, and ranking based on MVRatio values to make informed trading decisions.
---
**Note:** This indicator is for educational purposes and should be used alongside other analysis methods to make trading decisions.
Strength of Divergence Across Multiple Indicators (+CMF&VWMACD)Modified Version of Strength of Divergence Across Multiple Indicators by reees
Purpose:
This Pine Script indicator is designed to identify and evaluate the strength of bullish and bearish divergences across multiple technical indicators. Divergences occur when the price of an asset is moving in one direction while a technical indicator is moving in the opposite direction, potentially signaling a trend reversal.
Key Features:
1. Multiple Indicator Support: The script now analyzes divergences for the following indicators:
* RSI (Relative Strength Index)
* OBV (On-Balance Volume)
* MACD (Moving Average Convergence/Divergence)
* STOCH (Stochastic Oscillator)
* CCI (Commodity Channel Index)
* MFI (Money Flow Index)
* AO (Awesome Oscillator)
* CMF (Chaikin Money Flow) - Newly added
* VWMACD (Volume-Weighted MACD) - Newly added
2. Customizable Divergence Parameters:
* Bullish/Bearish: Enable or disable the detection of bullish and bearish divergences independently.
* Regular/Hidden: Detect both regular and hidden divergences (hidden divergences can indicate trend continuation).
* Broken Trendline Exclusion: Optionally ignore divergences where the trendline connecting price pivots is broken by an intermediate pivot.
* Pivot Lookback Periods: Adjust the number of bars used to identify valid pivot highs and lows for divergence calculations.
* Weighting: Assign different weights to regular vs. hidden divergences and to the relative change in price vs. the indicator.
3. Indicator-Specific Settings:
* Weight: Each indicator can be assigned a weight, influencing its contribution to the overall divergence strength calculation.
* Extreme Value: Define a threshold above which an indicator's divergence is considered "extreme," giving it a higher strength rating.
4. Divergence Strength Calculation:
* For each indicator, the script calculates a divergence "degree" based on the magnitude of the divergence and the user-defined weightings.
* The total divergence strength is the sum of the individual indicator divergence degrees.
* Strength is categorized as "Extreme," "Very strong," "Strong," "Moderate," "Weak," or "Very weak."
5. Visualization:
* Divergence Lines: The script draws lines on the chart connecting the price and indicator pivots that form a divergence (optional, with customizable transparency).
* Labels: Labels display the total divergence strength and a breakdown of each indicator's contribution. The size and visibility of labels are based on the strength.
6. Alerts:
* The script can generate alerts when the total divergence strength exceeds a user-defined threshold.
New Indicators (CMF and VWMACD):
* Chaikin Money Flow (CMF):
* Purpose: Measures the buying and selling pressure by analyzing the relationship between price, volume, and the accumulation/distribution line.
* Divergence: A bullish CMF divergence occurs when the price makes a lower low, but the CMF makes a higher low (suggesting increasing buying pressure). A bearish divergence is the opposite.
* Volume-Weighted MACD (VWMACD):
* Purpose: Similar to the standard MACD but uses volume-weighted moving averages instead of simple moving averages, giving more weight to periods with higher volume.
* Divergence: Divergences are interpreted similarly to the standard MACD, but the VWMACD can be more sensitive to volume changes.
How It Works (Simplified):
1. Pivot Detection: The script identifies pivot highs and lows in both price and the selected indicators using the specified lookback periods.
2. Divergence Check: For each indicator:
* It checks if a series of pivots in price and the indicator are diverging (e.g., price makes a lower low, but the indicator makes a higher low for a bullish divergence).
* It calculates the divergence degree based on the difference in price and indicator values, weightings, and whether it's a regular or hidden divergence.
3. Strength Aggregation: The script sums up the divergence degrees of all enabled indicators to get the total divergence strength.
4. Visualization and Alerts: It draws lines and labels on the chart to visualize the divergences and generates alerts if the total strength exceeds the set threshold.
Benefits:
* Comprehensive Divergence Analysis: By considering multiple indicators, the script provides a more robust assessment of potential trend reversals.
* Customization: The many adjustable parameters allow traders to fine-tune the script to their specific trading style and preferences.
* Objective Strength Evaluation: The divergence strength calculation and categorization offer a more objective way to evaluate the significance of divergences.
* Early Warning System: Divergences can often precede significant price movements, making this script a valuable tool for anticipating potential trend changes.
* Volume Confirmation: The inclusion of CMF and VWMACD add volume-based confirmation to the divergence signals, potentially increasing their reliability.
Limitations:
* Lagging Indicators: Most of the indicators used are lagging, meaning they are based on past price data. Divergences may sometimes occur after a significant price move has already begun.
* False Signals: No indicator is perfect, and divergences can sometimes produce false signals, especially in choppy or ranging markets.
* Subjectivity: While the script aims for objectivity, some settings (like weightings and extreme values) still involve a degree of subjective judgment.

Currency StrengthThis innovative Currency Strength Indicator is a powerful tool for forex traders, offering a comprehensive and visually intuitive way to analyze the relative strength of multiple currencies simultaneously. Here's what makes this indicator stand out:
Extensive Currency Coverage
One of the most striking features of this indicator is its extensive coverage of currencies. While many similar tools focus on just the major currencies, this indicator includes:
Major currencies: USD, EUR, JPY, GBP, CHF, CAD, AUD, NZD
Additional currencies: CNY, HKD, KRW, MXN, INR, RUB, SGD, TRY, BRL, ZAR, THB
This wide range allows traders to gain insights into a broader spectrum of the forex market, including emerging markets and less commonly traded currencies.
Unique Visual Presentation
The indicator boasts a clear and user-friendly interface:
Each currency is represented by a distinct colored line for easy identification
A legend is prominently displayed at the top of the chart, using color-coded labels for quick reference
Users can customize which currencies to display, allowing for a tailored analysis
This clean, organized presentation enables traders to quickly grasp the relative strengths of different currencies at a glance.
Robust Measurement Methodology
The indicator employs the True Strength Index (TSI) to calculate currency strength, which provides several advantages:
TSI is a momentum oscillator that shows both trend direction and overbought/oversold conditions
It uses two smoothing periods (fast and slow), which helps filter out market noise and provides more reliable signals
The indicator calculates TSI for each currency index (e.g., DXY for USD, EXY for EUR), ensuring a comprehensive strength measurement
By using TSI, this indicator offers a more nuanced and accurate representation of currency strength compared to simpler moving average-based indicators.
Customization and Flexibility
Traders can fine-tune the indicator to suit their needs:
Adjustable TSI parameters (fast and slow periods)
Ability to show/hide specific currencies
Customizable color scheme for each currency line
Practical Applications
This Currency Strength Indicator can be used for various trading strategies:
Identifying potential trend reversals when a currency reaches extreme overbought or oversold levels
Spotting divergences between currency pairs
Confirming trends across multiple timeframes
Enhancing multi-pair trading strategies
By providing a clear, comprehensive, and customizable view of currency strength across a wide range of currencies, this indicator equips traders with valuable insights for making informed trading decisions in the complex world of forex.

RSI from Rolling VWAP [CHE]Introducing the RSI from Rolling VWAP Indicator
Elevate your trading strategy with the RSI from Rolling VWAP —a cutting-edge indicator designed to provide unparalleled insights and enhance your decision-making on TradingView. This advanced tool seamlessly integrates the Relative Strength Index (RSI) with a Rolling Volume-Weighted Average Price (VWAP) to deliver precise and actionable trading signals.
Why Choose RSI from Rolling VWAP ?
- Clear Trend Detection: Our enhanced algorithms ensure accurate identification of bullish and bearish trends, allowing you to capitalize on market movements with confidence.
- Customizable Time Settings: Tailor the time window in days, hours, and minutes to align perfectly with your unique trading strategy and market conditions.
- Flexible Moving Averages: Select from a variety of moving average types—including SMA, EMA, WMA, and more—to smooth the RSI, providing clearer trend analysis and reducing market noise.
- Threshold Alerts: Define upper and lower RSI thresholds to effortlessly spot overbought or oversold conditions, enabling timely and informed trading decisions.
- Visual Enhancements: Enjoy a visually intuitive interface with color-coded RSI lines, moving averages, and background fills that make interpreting market data straightforward and efficient.
- Automatic Signal Labels: Receive immediate bullish and bearish labels directly on your chart, signaling potential trading opportunities without the need for constant monitoring.
Key Features
- Inspired by Proven Tools: Building upon the robust foundation of TradingView's Rolling VWAP, our indicator offers enhanced functionality and greater precision.
- Volume-Weighted Insights: By incorporating volume into the VWAP calculation, gain a deeper understanding of price movements and market strength.
- User-Friendly Configuration: Easily adjust settings to match your trading preferences, whether you're a novice trader or an experienced professional.
- Hypothesis-Driven Analysis: Utilize hypothetical results to backtest strategies, understanding that past performance does not guarantee future outcomes.
How It Works
1. Data Integration: Utilizes the `hlc3` (average of high, low, and close) as the default data source, with customization options available to suit your trading needs.
2. Dynamic Time Window: Automatically calculates the optimal time window based on an auto timeframe or allows for fixed time periods, ensuring flexibility and adaptability.
3. Rolling VWAP Calculation: Accurately computes the Rolling VWAP by balancing price and volume over the specified time window, providing a reliable benchmark for price action.
4. RSI Analysis: Measures momentum through RSI based on Rolling VWAP changes, smoothed with your chosen moving average for enhanced trend clarity.
5. Actionable Signals: Detects and labels bullish and bearish conditions when RSI crosses predefined thresholds, offering clear indicators for potential market entries and exits.
Seamless Integration with Your TradingView Experience
Adding the RSI from Rolling VWAP to your TradingView charts is straightforward:
1. Add to Chart: Simply copy the Pine Script code into TradingView's Pine Editor and apply it to your desired chart.
2. Customize Settings: Adjust the Source Settings, Time Settings, RSI Settings, MA Settings, and Color Settings to align with your trading strategy.
3. Monitor Signals: Watch for RSI crossings above or below your set thresholds, accompanied by clear labels indicating bullish or bearish trends.
4. Optimize Your Trades: Leverage the visual and analytical strengths of the indicator to make informed buy or sell decisions, maximizing your trading potential.
Disclaimer:
The content provided, including all code and materials, is strictly for educational and informational purposes only. It is not intended as, and should not be interpreted as, financial advice, a recommendation to buy or sell any financial instrument, or an offer of any financial product or service. All strategies, tools, and examples discussed are provided for illustrative purposes to demonstrate coding techniques and the functionality of Pine Script within a trading context.
Any results from strategies or tools provided are hypothetical, and past performance is not indicative of future results. Trading and investing involve high risk, including the potential loss of principal, and may not be suitable for all individuals. Before making any trading decisions, please consult with a qualified financial professional to understand the risks involved.
By using this script, you acknowledge and agree that any trading decisions are made solely at your discretion and risk.
Get Started Today
Transform your trading approach with the RSI from Rolling VWAP indicator. Experience the synergy of momentum and volume-based analysis, and unlock the potential for more accurate and profitable trades.
Download now and take the first step towards a more informed and strategic trading journey!
For further inquiries or support, feel free to contact
Best regards
Chervolino
Inspired by the acclaimed Rolling VWAP by TradingView

[Forex Fondamental Overview SGM]Fundamental analysis tool designed for currency trading in financial markets. The script generates a dashboard that displays key economic indicators for two selected currencies. Here is what makes this script particularly interesting for a trader:
1. Direct comparison between two currencies: The script allows you to choose two currencies (from a predefined list) and directly compare their key economic indicators such as interest rate, GDP growth, debt-to-GDP ratio, unemployment rate, inflation (CPI and PPI), and the services and manufacturing PMI indices. This gives you immediate insight into the economic strengths and weaknesses of each currency, which is crucial for making informed trading decisions.
2. Automatic data updating: Indicator values are updated automatically using security requests (request.security) that pull the most recent data available. This means you don't need to manually update data or check multiple sources; the script takes care of that for you.
3. Currency Relative Strength Calculation: The script calculates a strength index for each currency based on its economic indicators, and then it determines a relative strength index for the currency pair. This allows you to quickly see which currency is currently strongest, providing a basis for "buy strength, sell weakness" trading strategies.
4. Intuitive visualization: Results are presented in clear tables with colored indicators, making the information quickly digestible. For example, the background color changes depending on the relative strength of the currency pair, giving you an immediate visual signal of the overall trend.
5. Adaptability to different trading strategies: Whether you are a swing trader, a day trader, or a scalper, understanding the economic state of currencies can help you align your trading positions with underlying macroeconomic trends. This script gives you this information without requiring detailed economic analysis on your part.
In short, this script is a powerful tool for any Forex trader who wants to integrate fundamental analysis into their trading routine without bothering with the complexity of tracking and analyzing a multitude of economic indicators manually.

TASC 2023.12 Growth and Value Switching System█ OVERVIEW
This script implements a rotation system for trading value and growth ETFs, as developed by Markos Katsanos and detailed in the article titled 'Growth Or Value?' in TASC's December 2023 edition of Traders' Tips . The purpose of this script is to demonstrate how short-term momentum can be employed to track market trends and provide clarity on when to switch between value and growth.
█ CONCEPTS
The central concept of the presented rotation strategy is based on the observation that the stock market undergoes cycles favoring either growth or value stocks. Consequently, the script introduces a momentum trading system that is designed to switch between value and growth equities based on prevailing market conditions. Specifically tailored for long-term index investors, the system focuses on trading Vanguard's value and growth ETFs ( VTV and VUG ) on a weekly timeframe.
To identify the ETF likely to outperform, the script uses a custom relative strength indicator applied to both VTV and VUG in comparison with an index ( SPY ). To minimize risk and drawdowns during bear markets, when both value and growth experience downtrends, the script employs the author's custom volume flow indicator (VFI) and blocks trades when its reading indicates money outflow . Positions are closed if the relative strength of the current open trade ETF falls below that of the other ETF for two consecutive weeks and is also below its moving average. Additionally, the script implements a stop-loss when the ETF is trading below its 40-week moving average, but only during bear markets.
The script plots the relative strengths of the value and growth equities along with the signals triggered by the aforementioned rules. Information about the current readings of the relative strength and volume flow indicators, along with the current open position, is displayed in a table.
█ CALCULATIONS
The script uses the request.security() function to gather price data for both equities and the reference index. Custom relative strength and volume flow indicators are calculated based on the formulas presented in the original article. By default, the script employs the same parameters for these indicators as proposed in the original article for VTV and VUG on a weekly timeframe.

RSI-CCI Fusion StrategyRSI-CCI Fusion Strategy: Harnessing the Power of RSI and CCI
The "RSI-CCI Fusion Strategy" is a powerful trading approach that combines the strengths of the Relative Strength Index (RSI) and the Commodity Channel Index (CCI) to provide enhanced trading insights. This strategy is based on the popular "RSI & CCI Fusion + Alerts" indicator, which utilizes the RSI and CCI indicators from TradingView .
1. Overview of RSI and CCI:
The Relative Strength Index (RSI) is a widely used momentum oscillator that measures the speed and change of price movements. It helps traders identify overbought and oversold conditions in the market. On the other hand, the Commodity Channel Index (CCI) is a versatile indicator that identifies cyclical trends and provides insights into overbought and oversold levels.
2. The RSI-CCI Fusion Strategy:
The RSI-CCI Fusion Strategy harnesses the combined power of the RSI and CCI indicators to generate robust trading signals. By blending the RSI and CCI, this strategy captures both momentum and cyclical trend dynamics, offering a more comprehensive view of the market.
3. Utilizing the RSI-CCI Fusion Indicator + Alerts:
The "RSI & CCI Fusion + Alerts" indicator serves as the backbone of the RSI-CCI Fusion Strategy. It integrates the RSI and CCI indicators from TradingView, providing traders with a clear and actionable trading signal.
4. How it Works:
- The indicator calculates the RSI and CCI values, standardizes them using z-score, and combines them with a weighted fusion approach.
- The resulting RSI-CCI Fusion indicator is plotted on the chart, accompanied by dynamic upper and lower bands, which help identify potential overbought and oversold conditions.
- Traders can customize alerts based on their preferred thresholds and timeframes, enabling them to receive timely notifications for potential buy and sell signals.
5. Implementing the RSI-CCI Fusion Strategy:
Traders following the RSI-CCI Fusion Strategy can utilize the buy and sell signals generated by the RSI-CCI Fusion indicator. When the indicator crosses below the upper band, it may signal a potential selling opportunity. Conversely, when it crosses above the lower band, it may indicate a potential buying opportunity. Traders can also consider additional factors and technical analysis tools to validate the signals before making trading decisions.
Conclusion: The RSI-CCI Fusion Strategy provides traders with a robust approach to analyze the market and make well-informed trading decisions. By incorporating the RSI and CCI indicators through the "RSI & CCI Fusion + Alerts" indicator, traders can take advantage of the combined strengths of these indicators. However, it is important to remember that no strategy guarantees success, and traders should always practice risk management and conduct thorough analysis before executing trades using this strategy.
Disclaimer: Trading involves risks, and it is important to conduct your own research and consult with a financial advisor before making any investment decisions.
Note: The RSI-CCI Fusion Strategy serves as a general guide, and individual traders may have different preferences and trading styles.

Smart Money Alpha Signals (Performance Dashboard) Smart Money Alpha Signals: Identifying Market Leaders & Generating Alpha
GMP Alpha Signals (Global Market Performance Alpha) is a specialized analysis tool designed not merely to find stocks that are rising, but to identify "Alpha" assets—Market Leaders that defend their price or rise even under adverse conditions where the market index falls or consolidates.
This indicator visualizes the concept of Comparative Relative Strength (RS) and Smart Money accumulation patterns, helping traders capture profit opportunities even during bearish market phases.
Key Objectives (Purpose)
Alpha Capture: Identifying assets generating 'excess returns' that outperform the market Beta.
Smart Money Tracking: Detecting traces of 'institutional buying' and 'accumulation' that defend prices during index plunges.
Decoupling Identification: Spotting assets moving on independent catalysts or momentum, regardless of the broader market direction.
Stop Hunt Filtering: Distinguishing 'fake drops' where price dips temporarily, but Relative Strength remains intact.
Dashboard Guide
Interpretation of the information panel (Table) displayed on the chart.
Rel. Performance: Shows the excess return compared to the index over the set period. (Positive/Green = Stronger than the market).
Decoupling Strength: The correlation coefficient with the index. Lower values (0 or negative) indicate movement independent of market risk.
Bullish: The count/rate of rising or limiting losses when the index drops sharply (e.g., < -0.5%). (Gold = Market Crash Leader).
Defended: The count/rate of holding support levels when the index shows mild weakness (e.g., < -0.05%). (Gold = Strong Accumulation).
Bench. Defense: The defense rate of the comparison benchmark (e.g., TSLA, ETH). Your target asset must be higher to be considered the sector leader.
Input Options & Settings Guide
You can optimize settings according to your trading style and asset class (Stocks/Crypto).
(1) Main Settings
Major Index: The baseline market index for comparison.
(US Stocks: NASDAQ:NDX or TVC:SPX / Crypto: BINANCE:BTCUSDT)
Benchmark Symbol: A competitor within the sector.
(e.g., Set NVDA when analyzing Semiconductor stocks).
Correlation Lookback: The lookback period for judging decoupling. (Default: 30)
Performance Lookback: The number of bars to calculate cumulative returns and defense rates. (Default: 60)
(2) Dashboard Thresholds
These settings define the criteria for what qualifies as "Defended" or "Bullish".
Performance (Max %): Used to find assets that haven't pumped yet. Signals trigger only when Alpha is below this value.
Defended Logic:
Index Drop Condition: The index must drop by at least this amount to start checking. (e.g., -0.05%)
Asset Buffer: How much the asset must outperform the index drop.
(Example: If Index drops -1.0% and Buffer is 0.2%, the asset must be at least -0.8% to count as 'Defended').
Bullish Logic: Measures resilience during steeper market dumps (e.g., -0.5% drop) compared to the Defended Logic.
Volume Settings: Decides whether to count Defended/Bullish instances only when accompanied by volume above the SMA.
(3) Signal Logic Settings (Crucial)
Customize conditions to trigger alerts. The choice between AND / OR is crucial.
AND: Condition must be met SIMULTANEOUSLY with other active conditions (Conservative/High Certainty).
OR: Condition triggers the signal INDEPENDENTLY (Aggressive/Opportunity Capture).
Performance: Is the relative performance within the threshold? (Basic Filter).
Decoupling: Has the correlation dropped? (Start of independent move).
Bullish Rate: Is the Bullish rate high during market dumps?
Defended Rate (High): (Recommended) Is there continuous price defense occurring? (Accumulation detection).
Defended Rate (Low): (Warning) Has the defense rate broken down? (For Stop Loss).
Defended > Benchmark: Is it stronger than the Benchmark (2nd tier)?
Volume Spike: Has volume surged compared to the average? (Institutional involvement).
RSI Oversold: Is it in oversold territory? (Counter-trend trading).
Decoupling Move: Does the current bar show the "Index Down / Asset Up" pattern?
Min USD Volume: Transaction value filter (To exclude low liquidity assets).

Adaptive Trend Mapper-ATM (Arjo)Adaptive Trend Mapper (ATM) is a multi-factor trend, momentum, and compression-analysis tool designed to help traders visually map the strength and direction of market pressure.
Instead of simply combining existing indicators, ATM creates a new composite framework that blends momentum imbalance, directional strength, volatility contraction, and adaptive smoothing into a single, unified model.
Originality and usefulness
Adaptive Trend Mapper (ATM) does not replicate any one indicator.
It generates two custom indices— Bull Pressure Index and Bear Pressure Index —derived from a mathematical combination of RSI, inverse-RSI, and ADX. These indices behave differently from traditional oscillators:
They represent directional pressure on a 0–100 scale , not momentum.
They are designed to converge/diverge, forming a basis for the built-in Squeeze Detection Engine.
They can be optionally step-compressed , making the movement easier to read on fast or small charts.
The script also integrates a custom SuperSmoother trend model (not TradingView’s built-in function), which acts as an adaptive trend curve on the chart.
All calculations are combined intentionally—not as a mashup—to create a framework that allows traders to understand trend strength, compression phases, and micro-trend shifts in one place.
How the Indicator Works
1. Bull & Bear Pressure Indices:
These indices measure directional imbalance:
Bull Index = ADX strength weighted against inverse-RSI
Bear Index = ADX strength weighted against normal RSI
This produces two opposing pressure curves that rise or fall depending on whether buyers or sellers dominate.
You can optionally smooth these using:
SMA / EMA / WMA / RMA via the “Smoothing Settings” panel.
2. Squeeze & Compression Detection:
A squeeze is detected when:
ADX stays below a user-defined threshold
Bull–Bear Index difference shrinks
Average difference is falling (convergence)
This is a volatility-contraction model inspired by squeeze logic but applied to directional pressure, not Bollinger Bands/Keltner Channels .
3. Adaptive Trend Curve (SuperSmoother Engine)
The indicator applies a two-pole SuperSmoother filter to the price, then smooths it again using EMA.
The slope color flips between bullish and bearish and is displayed using:
A thin SuperSmoother curve
A thicker band for visual context
4. EMA-50 Trend Context:
An optional EMA-50 helps identify broad directional bias .
5. Step-Based Scaling
You can quantize the Bull/Bear indices using custom step intervals.
This makes the indicator easier to read on noisy intraday charts.
How to Use the Indicator
1. Trend Analysis
A rising Bull Index shows strengthening upward pressure
A rising Bear Index shows strengthening downward pressure
Wide divergence between the indices signals a strong trend
2. Compression / Squeeze Analysis
Yellow background = volatility compression + pressure convergence
Breakouts from this zone often precede directional expansion
3. Trendline Reading
SuperSmoother line color flip = micro trend shift
EMA-50 slope gives macro-trend direction
Perfect for combining trend and momentum maps on the same chart
4. Visual Interpretation
Cyan/teal → strong bullish pressure
Purple/red/orange → various levels of bearish control
Neutral/teal background → weak ADX
Yellow background → squeeze zone
Open-Source Notes
This script uses:
TradingView built-in RSI, ADX/DMI, and smoothing functions
A SuperSmoother implementation based on known DSP filter coefficients
All remaining logic, signal methods, composite indices, and compression model are original developments by ARJO .
The script is published open-source to comply with TradingView’s reuse policy.
Disclaimer
This tool is for educational and analytical purposes only.
It does not generate buy or sell signals.
Always use proper risk management.
Happy Trading (ARJO)

Debt-Cycle vs Bitcoin-CycleDebt-Cycle vs Bitcoin-Cycle Indicator
The Debt-Cycle vs Bitcoin-Cycle indicator is a macro-economic analysis tool that compares traditional financial market cycles (debt/credit cycles) against Bitcoin market cycles. It uses Z-score normalization to track the relative positioning of global financial conditions versus cryptocurrency market sentiment, helping identify potential turning points and divergences between traditional finance and digital assets.
Key Features
Dual-Cycle Analysis: Simultaneously tracks traditional financial cycles and Bitcoin-specific cycles
Z-Score Normalization: Standardizes diverse data sources for meaningful comparison
Multi-Asset Coverage: Analyzes currencies, commodities, bonds, monetary aggregates, and on-chain metrics
Divergence Detection: Identifies when Bitcoin cycles move independently from traditional finance
21-Day Timeframe: Optimized for Long-term cycle analysis
What It Measures
Finance-Cycle (White Line)
Tracks traditional financial market health through:
Currencies: USD strength (DXY), global currency weights (USDWCU, EURWCU)
Commodities: Oil, gold, natural gas, agricultural products, and Bitcoin price
Corporate Bonds: Investment-grade spreads, high-yield spreads, credit conditions
Monetary Aggregates: M2 money supply, foreign exchange reserves (weighted by currency)
Treasury Bonds: Yield curve (2Y/10Y, 3M/10Y), term premiums, long-term rates
Bitcoin-Cycle (Orange Line)
Tracks Bitcoin market positioning through:
On-Chain Metrics:
MVRV Ratio (Market Value to Realized Value)
NUPL (Net Unrealized Profit/Loss)
Profit/Loss Address Distribution
Technical Indicators:
Bitcoin price Z-score
Moving average deviation
Relative Strength:
ETH/BTC ratio (altcoin strength indicator)
Visual Elements
White Line: Finance-Cycle indicator (positive = expansionary conditions, negative = contractionary)
Orange Line: Bitcoin-Cycle indicator (positive = bullish positioning, negative = bearish)
Zero Line: Neutral reference point
Interpretation
Cycle Alignment
Both positive: Risk-on environment, favorable for crypto
Both negative: Risk-off environment, caution warranted
Divergence: Potential opportunities or warning signals
Divergence Signals
Finance positive, Bitcoin negative: Bitcoin may be undervalued relative to macro conditions
Finance negative, Bitcoin positive: Bitcoin may be overextended or decoupling from traditional finance
Important Limitations
This indicator uses some technical and macro data but still has significant gaps:
⚠️ Limited monetary data - missing:
Funding rates (repo, overnight markets)
Comprehensive bond spread analysis
Collateral velocity and quality metrics
Central bank balance sheet details
⚠️ Basic economic coverage - missing:
GDP growth rates
Inflation expectations
Employment data
Manufacturing indices
Consumer confidence
⚠️ Simplified on-chain analysis - missing:
Exchange flow data
Whale wallet movements
Mining difficulty adjustments
Hash rate trends
Network fee dynamics
⚠️ No sentiment data - missing:
Fear & Greed Index
Options positioning
Futures open interest
Social media sentiment
The indicator provides a high-level cycle comparison but should be combined with comprehensive fundamental analysis, detailed on-chain research, and proper risk management.
Settings
Offset: Adjust the horizontal positioning of the indicators (default: 0)
Timeframe: Fixed at 21 days for optimal cycle detection
Use Cases
Macro-crypto correlation analysis: Understand when Bitcoin moves with or against traditional markets
Cycle timing: Identify potential tops and bottoms in both cycles
Risk assessment: Gauge overall market conditions across asset classes
Divergence trading: Spot opportunities when cycles diverge significantly
Portfolio allocation: Balance traditional and crypto assets based on cycle positioning
Technical Notes
Uses Z-score normalization with varying lookback periods (40-60 bars)
Applies HMA (Hull Moving Average) smoothing to reduce noise
Asymmetric multipliers for upside/downside movements in certain metrics
Requires access to FRED economic data, Glassnode, CoinMetrics, and IntoTheBlock feeds
21-day timeframe optimized for cycle analysis
Strategy Applications
This indicator is particularly useful for:
Cross-asset allocation - Decide between traditional finance and crypto exposure
Cycle positioning - Identify where we are in credit/debt cycles vs. Bitcoin cycles
Regime changes - Detect shifts in market leadership and correlation patterns
Risk management - Reduce exposure when both cycles turn negative
Disclaimer: This indicator is a cycle analysis tool and should not be used as the sole basis for investment decisions. It has limited coverage of monetary conditions, economic fundamentals, and on-chain metrics. The indicator provides directional insight but cannot predict exact timing or magnitude of market moves. Always conduct thorough research, consider multiple data sources, and maintain proper risk management in all investment decisions.

RSI (Custom Background) KDMThis code is a custom version of the RSI (Relative Strength Index) indicator.
Its main purpose is to compare recent price gains and losses to determine whether the market is in an overbought or oversold condition.
30–50 zone (purple tone): represents a weak or pullback area.
50–70 zone (green tone): represents a strengthening or dominant buying area.
Additionally, when the RSI line moves above 70, a green gradient background highlights the overbought region; when it moves below 30, a red gradient background emphasizes the oversold region.
Like the classic RSI, this version is a momentum indicator showing whether the price is losing or gaining strength.
The key difference is the colored background, which allows you to visually identify the RSI zones (e.g., 30–50 weak, 50–70 strong) much faster and more clearly.

Dashboard — Vol & PriceDashboard for traders
Indicator Description
1. Prev Day High
What it shows: the previous trading day's high.
Why it shows: a resistance level. Many traders watch to see if the price will hold above or below this level. A breakout can signal buying strength.
2. Prev Day Low
What it shows: the previous day's low.
Why it shows: a support level. If the price breaks downwards, it signals weakness and a possible continuation of the decline.
3. Today
What it shows:
The difference between the current price and yesterday's close (in absolute values and as a percentage).
Color: green for an increase, red for a decrease.
Why it shows: immediately shows how strong a gap or movement is today relative to yesterday. This is an indicator of current momentum.
4. ADR, % (Average Daily Range)
What it shows: Average daily range (High – Low), expressed as a percentage of the closing price, for the selected period (default 7 days).
Why it's useful: To understand the "normal" volatility of an instrument. For example, if the ADR is 3%, then a 1% move is small, while a 6% move is very large.
5. ATR (Average True Range)
What it shows: Average fluctuation range (including gaps), in absolute points, for the specified period (default 7 days).
Why it's useful: A classic volatility indicator. Useful for setting stops, calculating position sizes, and identifying "noise" movements.
6. ATR (Today), %
What it shows: How much the current movement today (from yesterday's close to the current price) represents in % of the average ATR.
Why it shows: Shows whether the instrument has "played out" its average range. If the value is already >100%, there is a high probability that the movement will begin to slow.
7. Vol (Today)
What it shows:
Current trading volume for the day (in millions/billions).
Comparison with yesterday as a percentage (for example: 77.32M (-52.78%)).
Color: green if the volume is higher than yesterday; red if lower.
Why it shows:Quickly shows whether the market is active today. Volume = fuel for price movement.
8. Avg Vol (20d)
What it shows: Average daily volume over the last 20 trading days.
Why it's useful:"normal" activity level. It's a convenient backdrop for assessing today's turnover.
9. Rel. Vol (Today), % (Relative Volume)
What it shows: Deviation of the current volume from the average (20 days).
Formula: `(today / average - 1)` * 100`.
+30% = volume 30% above average, -40% = 40% below average.
Color: green for +, red for –.
Why it's useful:A key indicator for a trader. If RelVol > 100% (green), the market is "charged," and the movement is more significant. If low, activity is weak and movements are less reliable.
10. Normalized RS (Relative Strength)
What it shows: the relative strength of a stock to a selected benchmark (e.g., SPY), normalized by the period (default 7 days).
100 = same result as the market.
> 100 = the stock is stronger than the index.
<100 = weaker than the index.
Why it's needed: filtering ideas. Strong stocks rise faster when the market rises, weak stocks fall more sharply. This helps trade in the direction of the trend and select the best candidates.
In summary:
Prev High / Low — key support and resistance levels.
Today — an instant understanding of the current momentum.
ADR and ATR — volatility and potential movement.
ATR (Today) — how much the instrument has already "run."
Vol + Rel.Vol — activity and confirmation of the movement's strength.
RS — selecting strong/weak leaders against the market.
Power RSI Segment Runner [CHE] Power RSI Segment Runner — Tracks RSI momentum across higher timeframe segments to detect directional switches for trend confirmation.
Summary
This indicator calculates a running Relative Strength Index adapted to segments defined by changes in a higher timeframe, such as daily closes, providing a smoothed view of momentum within each period. It distinguishes between completed segments, which fix the final RSI value, and ongoing ones, which update in real time with an exponential moving average filter. Directional switches between bullish and bearish momentum trigger visual alerts, including overlay lines and emojis, while a compact table displays current trend strength as a progress bar. This segmented approach reduces noise from intra-period fluctuations, offering clearer signals for trend persistence compared to standard RSI on lower timeframes.
Motivation: Why this design?
Standard RSI often generates erratic signals in choppy markets due to constant recalculation over fixed lookback periods, leading to false reversals that mislead traders during range-bound or volatile phases. By resetting the RSI accumulation at higher timeframe boundaries, this indicator aligns momentum assessment with broader market cycles, capturing sustained directional bias more reliably. It addresses the gap between short-term noise and long-term trends, helping users filter entries without over-relying on absolute overbought or oversold thresholds.
What’s different vs. standard approaches?
- Baseline Reference: Diverges from the classic Wilder RSI, which uses a fixed-length exponential moving average of gains and losses across all bars.
- Architecture Differences:
- Segments momentum resets at higher timeframe changes, isolating calculations per period instead of continuous history.
- Employs persistent sums for ups and downs within segments, with on-the-fly RSI derivation and EMA smoothing.
- Integrates switch detection logic that clears prior visuals on reversal, preventing clutter from outdated alerts.
- Adds overlay projections like horizontal price lines and dynamic percent change trackers for immediate trade context.
- Practical Effect: Charts show discrete RSI endpoints for past segments alongside a curved running trace, making momentum evolution visually intuitive. Switches appear as clean, extendable overlays, reducing alert fatigue and highlighting only confirmed directional shifts, which aids in avoiding whipsaws during minor pullbacks.
How it works (technical)
The indicator begins by detecting changes in the specified higher timeframe, such as a new daily bar, to define segment boundaries. At each boundary, it finalizes the prior segment's RSI by summing positive and negative price changes over that period and derives the value from the ratio of those sums, then applies an exponential moving average for smoothing. Within the active segment, it accumulates ongoing ups and downs from price changes relative to the source, recalculating the running RSI similarly and smoothing it with the same EMA length.
Points for the running RSI are collected into an array starting from the segment's onset, forming a curved polyline once sufficient bars accumulate. Comparisons between the running RSI and the last completed segment's value determine the current direction as long, short, or neutral, with switches triggering deletions of old visuals and creation of new ones: a label at the RSI pane, a vertical dashed line across the RSI range, an emoji positioned via ATR offset on the price chart, a solid horizontal line at the switch price, a dashed line tracking current close, and a midpoint label for percent change from the switch.
Initialization occurs on the first bar by resetting accumulators, and visualization gates behind a minimum bar count since the segment start to avoid early instability. The trend strength table builds vertically with filled cells proportional to the rounded RSI value, colored by direction. All drawing objects update or extend on subsequent bars to reflect live progress.
Parameter Guide
EMA Length — Controls the smoothing applied to the running RSI; higher values increase lag but reduce noise. Default: 10. Trade-offs: Shorter settings heighten sensitivity for fast markets but risk more false switches; longer ones suit trending conditions for stability.
Source — Selects the price data for change calculations, typically close for standard momentum. Default: close. Trade-offs: Open or high/low may emphasize gaps, altering segment intensity.
Segment Timeframe — Defines the higher timeframe for segment resets, like daily for intraday charts. Default: D. Trade-offs: Shorter frames create more frequent but shorter segments; longer ones align with major cycles but delay resets.
Overbought Level — Sets the upper threshold for potential overbought conditions (currently unused in visuals). Default: 70. Trade-offs: Adjust for asset volatility; higher values delay bearish warnings.
Oversold Level — Sets the lower threshold for potential oversold conditions (currently unused in visuals). Default: 30. Trade-offs: Lower values permit deeper dips before signaling bullish potential.
Show Completed Label — Toggles labels at segment ends displaying final RSI. Default: true. Trade-offs: Enables historical review but can crowd charts on dense timeframes.
Plot Running Segment — Enables the curved polyline for live RSI trace. Default: true. Trade-offs: Visualizes intra-segment flow; disable for cleaner panes.
Running RSI as Label — Displays current running RSI as a forward-projected label on the last bar. Default: false. Trade-offs: Useful for quick reads; may overlap in tight scales.
Show Switch Label — Activates RSI pane labels on directional switches. Default: true. Trade-offs: Provides context; omit to minimize pane clutter.
Show Switch Line (RSI) — Draws vertical dashed lines across the RSI range at switches. Default: true. Trade-offs: Marks reversal bars clearly; extends both ways for reference.
Show Solid Overlay Line — Projects a horizontal line from switch price forward. Default: true. Trade-offs: Acts as dynamic support/resistance; wider lines enhance visibility.
Show Dashed Overlay Line — Tracks a dashed line from switch to current close. Default: true. Trade-offs: Shows price deviation; thinner for subtlety.
Show Percent Change Label — Midpoint label tracking percent move from switch. Default: true. Trade-offs: Quantifies progress; centers dynamically.
Show Trend Strength Table — Displays right-side table with direction header and RSI bar. Default: true. Trade-offs: Instant strength gauge; fixed position avoids overlap.
Activate Visualization After N Bars — Delays signals until this many bars into a segment. Default: 3. Trade-offs: Filters immature readings; higher values miss early momentum.
Segment End Label — Color for completed RSI labels. Default: 7E57C2. Trade-offs: Purple tones for finality.
Running RSI — Color for polyline and running elements. Default: yellow. Trade-offs: Bright for live tracking.
Long — Color for bullish switch visuals. Default: green. Trade-offs: Standard for uptrends.
Short — Color for bearish switch visuals. Default: red. Trade-offs: Standard for downtrends.
Solid Line Width — Thickness of horizontal overlay line. Default: 2. Trade-offs: Bolder for emphasis on key levels.
Dashed Line Width — Thickness of tracking and vertical lines. Default: 1. Trade-offs: Finer to avoid dominance.
Reading & Interpretation
Completed segment RSIs appear as static points or labels in purple, indicating the fixed momentum at period close—values drifting toward the upper half suggest building strength, while lower half implies weakness. The yellow curved polyline traces the live smoothed RSI within the current segment, rising for accumulating gains and falling for losses. Directional labels and lines in green or red flag switches: green for running momentum exceeding the prior segment's, signaling potential uptrend continuation; red for the opposite.
The right table's header colors green for long, red for short, or gray for neutral/wait, with filled purple bars scaling from bottom (low RSI) to top (high), topped by the numeric value. Overlay elements project from switch bars: the solid green/red line as a price anchor, dashed tracker showing pullback extent, and percent label quantifying deviation—positive for alignment with direction, negative for counter-moves. Emojis (up arrow for long, down for short) float above/below price via ATR spacing for quick chart scans.
Practical Workflows & Combinations
- Trend Following: Enter long on green switch confirmation after a higher high in structure; filter with table strength above midpoint for conviction. Pair with volume surge for added weight.
- Exits/Stops: Trail stops to the solid overlay line on pullbacks; exit if percent change reverses beyond 2 percent against direction. Use wait bars to confirm without chasing.
- Multi-Asset/Multi-TF: Defaults suit forex/stocks on 1H-4H with daily segments; for crypto, shorten EMA to 5 for volatility. Scale segment TF to weekly for daily charts across indices.
- Combinations: Overlay on EMA clouds for confluence—switch aligning with cloud break strengthens signal. Add volatility filters like ATR bands to debounce in low-volume regimes.
Behavior, Constraints & Performance
Signals confirm on bar close within segments, with running polyline updating live but gated by minimum bars to prevent flicker. Higher timeframe changes may introduce minor repaints on timeframe switches, mitigated by relying on confirmed HTF closes rather than intrabar peeks. Resource limits cap at 500 labels/lines and 50 polylines, pruning old objects on switches to stay efficient; no explicit loops, but array growth ties to segment length—suitable for up to 500-bar histories without lag.
Known limits include delayed visualization in short segments and insensitivity to overbought/oversold levels, as thresholds are inputted but not actively visualized. Gaps in source data reset accumulators prematurely, potentially skewing early RSI.
Sensible Defaults & Quick Tuning
Start with EMA length 10, daily segments, and 3-bar wait for balanced responsiveness on hourly charts. For excessive switches in ranging markets, increase wait bars to 5 or EMA to 14 to dampen noise. If signals lag in trends, drop EMA to 5 and use 1H segments. For stable assets like indices, widen to weekly segments; tune colors for dark/light themes without altering logic.
What this indicator is—and isn’t
This tool serves as a momentum visualization and switch detector layered over price action, aiding trend identification and confirmation in segmented contexts. It is not a standalone trading system, predictive model, or risk calculator—always integrate with broader analysis, position sizing, and stop-loss discipline. View it as an enhancement for discretionary setups, not automated alerts without validation.
Disclaimer
The content provided, including all code and materials, is strictly for educational and informational purposes only. It is not intended as, and should not be interpreted as, financial advice, a recommendation to buy or sell any financial instrument, or an offer of any financial product or service. All strategies, tools, and examples discussed are provided for illustrative purposes to demonstrate coding techniques and the functionality of Pine Script within a trading context.
Any results from strategies or tools provided are hypothetical, and past performance is not indicative of future results. Trading and investing involve high risk, including the potential loss of principal, and may not be suitable for all individuals. Before making any trading decisions, please consult with a qualified financial professional to understand the risks involved.
By using this script, you acknowledge and agree that any trading decisions are made solely at your discretion and risk.
Do not use this indicator on Heikin-Ashi, Renko, Kagi, Point-and-Figure, or Range charts, as these chart types can produce unrealistic results for signal markers and alerts.
Best regards and happy trading
Chervolino

SECTOR ROTATION Sector Rotation Indicator with Auto Chart Symbol
This indicator helps traders track relative performance across multiple indices/sectors simultaneously, making it easy to identify sector rotation and market leadership.
Key Features:
✅ 21 Symbols Tracking: Monitor 20 customizable symbols + your current chart symbol automatically(DIVIDEND SYMBOL)
✅ Percentage Performance: All moving averages show percentage gain/loss from 1 timeframe period ago
✅ Color-Coded Visualization: Heat map coloring (red to green) based on relative performance ranking
✅ Flexible Timeframes: Works on any timeframe from 1-minute to 12-month charts
✅ Performance Table: Quick-view table showing candle performance with inside/outside bar detection
✅ Indian Market Ready: Pre-configured with NSE indices (NIFTY, BANKNIFTY, and sectoral indices)
Default Symbols (Customizable):
NIFTY, CNXSMALLCAP, CNXMIDCAP, BANKNIFTY
Sector indices: IT, AUTO, PHARMA, METAL, ENERGY, FMCG, etc.
Plus your current chart symbol (automatically added)
How It Works:
Select your preferred timeframe (1D, 1W, 1M, etc.)
The indicator calculates percentage performance from given period ago
Moving averages show smoothed performance trends
Colors indicate relative strength: Green = outperformers, Red = underperformers
Perfect For:
Sector rotation analysis
Relative strength comparison
Market breadth assessment
Index/ETF traders
Swing and position traders
Settings:
Adjustable MA length (default: 20)
Customizable colors and table position
Show/hide percentage labels
Horizontal or vertical table layout
This is not any buy or sell signal or recommendation, consult with your advisor first.

Advanced Speedometer Gauge [PhenLabs]Advanced Speedometer Gauge
Version: PineScript™v6
📌 Description
The Advanced Speedometer Gauge is a revolutionary multi-metric visualization tool that consolidates 13 distinct trading indicators into a single, intuitive speedometer display. Instead of cluttering your workspace with multiple oscillators and panels, this gauge provides a unified interface where you can switch between different metrics while maintaining consistent visual interpretation.
Built on PineScript™ v6, the indicator transforms complex technical calculations into an easy-to-read semi-circular gauge with color-coded zones and a precision needle indicator. Each of the 13 available metrics has been carefully normalized to a 0-100 scale, ensuring that whether you’re analyzing RSI, volume trends, or volatility extremes, the visual interpretation remains consistent and intuitive.
The gauge is designed for traders who value efficiency and clarity. By consolidating multiple analytical perspectives into one compact display, you can quickly assess market conditions without the visual noise of traditional multi-indicator setups. All metrics are non-overlapping, meaning each provides unique insights into different aspects of market behavior.
🚀 Points of Innovation
13 selectable metrics covering momentum, volume, volatility, trend, and statistical analysis, all accessible through a single dropdown menu
Universal 0-100 normalization system that standardizes different indicator scales for consistent visual interpretation across all metrics
Semi-circular gauge design with 21 arc segments providing smooth precision and clear visual feedback through color-coded zones
Non-redundant metric selection ensuring each indicator provides unique market insights without analytical overlap
Advanced metrics including MFI (volume-weighted momentum), CCI (statistical deviation), Volatility Rank (extended lookback), Trend Strength (ADX-style), Choppiness Index, Volume Trend, and Price Distance from MA
Flexible positioning system with 5 chart locations, 3 size options, and fully customizable color schemes for optimal workspace integration
🔧 Core Components
Metric Selection Engine: Dropdown interface allowing instant switching between 13 different technical indicators, each with independent parameter controls
Normalization System: All metrics converted to 0-100 scale using indicator-specific algorithms that preserve the statistical significance of each measurement
Semi-Circular Gauge: Visual display using 21 arc segments arranged in curved formation with two-row thickness for enhanced visibility
Color Zone System: Three distinct zones (0-40 green, 40-70 yellow, 70-100 red) providing instant visual feedback on metric extremes
Needle Indicator: Dynamic pointer that positions across the gauge arc based on precise current metric value
Table Implementation: Professional table structure ensuring consistent positioning and rendering across different chart configurations
🔥 Key Features
RSI (Relative Strength Index): Classic momentum oscillator measuring overbought/oversold conditions with adjustable period length (default 14)
Stochastic Oscillator: Compares closing price to price range over specified period with smoothing, ideal for identifying momentum shifts
MFI (Money Flow Index): Volume-weighted RSI that combines price movement with volume to measure buying and selling pressure intensity
CCI (Commodity Channel Index): Measures statistical deviation from average price, normalized from typical -200 to +200 range to 0-100 scale
Williams %R: Alternative overbought/oversold indicator using high-low range analysis, inverted to match 0-100 scale conventions
Volume %: Current volume relative to moving average expressed as percentage, capped at 100 for extreme spikes
Volume Trend: Cumulative directional volume flow showing whether volume is flowing into up moves or down moves over specified period
ATR Percentile: Current Average True Range position within historical range using specified lookback period (default 100 bars)
Volatility Rank: Close-to-close volatility measured against extended historical range (default 252 days), differs from ATR in calculation method
Momentum: Rate of change calculation showing price movement speed, centered at 50 and normalized to 0-100 range
Trend Strength: ADX-style calculation using directional movement to quantify trend intensity regardless of direction
Choppiness Index: Measures market choppiness versus trending behavior, where high values indicate ranging markets and low values indicate strong trends
Price Distance from MA: Measures current price over-extension from moving average using standard deviation calculations
🎨 Visualization
Semi-Circular Arc Display: Curved gauge spanning from 0 (left) to 100 (right) with smooth progression and two-row thickness for visibility
Color-Coded Zones: Green zone (0-40) for low/oversold conditions, yellow zone (40-70) for neutral readings, red zone (70-100) for high/overbought conditions
Needle Indicator: Downward-pointing triangle (▼) positioned precisely at current metric value along the gauge arc
Scale Markers: Vertical line markers at 0, 25, 50, 75, and 100 positions with corresponding numerical labels below
Title Display: Merged cell showing “𓄀 PhenLabs” branding plus currently selected metric name in monospace font
Large Value Display: Current metric value shown with two decimal precision in large text directly below title
Table Structure: Professional table with customizable background color, text color, and transparency for minimal chart obstruction
📖 Usage Guidelines
Metric Selection
Select Metric: Default: RSI | Options: RSI, Stochastic, Volume %, ATR Percentile, Momentum, MFI (Money Flow), CCI (Commodity Channel), Williams %R, Volatility Rank, Trend Strength, Choppiness Index, Volume Trend, Price Distance | Choose the technical indicator you want to display on the gauge based on your current analytical needs
RSI Settings
RSI Length: Default: 14 | Range: 1+ | Controls the lookback period for RSI calculation, shorter periods increase sensitivity to recent price changes
Stochastic Settings
Stochastic Length: Default: 14 | Range: 1+ | Lookback period for stochastic calculation comparing close to high-low range
Stochastic Smooth: Default: 3 | Range: 1+ | Smoothing period applied to raw stochastic value to reduce noise and false signals
Volume Settings
Volume MA Length: Default: 20 | Range: 1+ | Moving average period used to calculate average volume for comparison with current volume
Volume Trend Length: Default: 20 | Range: 5+ | Period for calculating cumulative directional volume flow trend
ATR and Volatility Settings
ATR Length: Default: 14 | Range: 1+ | Period for Average True Range calculation used in ATR Percentile metric
ATR Percentile Lookback: Default: 100 | Range: 20+ | Historical range used to determine current ATR position as percentile
Volatility Rank Lookback (Days): Default: 252 | Range: 50+ | Extended lookback period for Volatility Rank metric using close-to-close volatility
Momentum and Trend Settings
Momentum Length: Default: 10 | Range: 1+ | Lookback period for rate of change calculation in Momentum metric
Trend Strength Length: Default: 20 | Range: 5+ | Period for directional movement calculations in ADX-style Trend Strength metric
Advanced Metric Settings
MFI Length: Default: 14 | Range: 1+ | Lookback period for Money Flow Index calculation combining price and volume
CCI Length: Default: 20 | Range: 1+ | Period for Commodity Channel Index statistical deviation calculation
Williams %R Length: Default: 14 | Range: 1+ | Lookback period for Williams %R high-low range analysis
Choppiness Index Length: Default: 14 | Range: 5+ | Period for calculating market choppiness versus trending behavior
Price Distance MA Length: Default: 50 | Range: 10+ | Moving average period used for Price Distance standard deviation calculation
Visual Customization
Position: Default: Top Right | Options: Top Left, Top Right, Bottom Left, Bottom Right, Middle Right | Controls gauge placement on chart for optimal workspace organization
Size: Default: Normal | Options: Small, Normal, Large | Adjusts overall gauge dimensions and text size for different monitor resolutions and preferences
Low Zone Color (0-40): Default: Green (#00FF00) | Customize color for low/oversold zone of gauge arc
Medium Zone Color (40-70): Default: Yellow (#FFFF00) | Customize color for neutral/medium zone of gauge arc
High Zone Color (70-100): Default: Red (#FF0000) | Customize color for high/overbought zone of gauge arc
Background Color: Default: Semi-transparent dark gray | Customize gauge background for contrast and chart integration
Text Color: Default: White (#FFFFFF) | Customize all text elements including title, value, and scale labels
✅ Best Use Cases
Quick visual assessment of market conditions when you need instant feedback on whether an asset is in extreme territory across multiple analytical dimensions
Workspace organization for traders who monitor multiple indicators but want to reduce chart clutter and visual complexity
Metric comparison by switching between different indicators while maintaining consistent visual interpretation through the 0-100 normalization
Overbought/oversold identification using RSI, Stochastic, Williams %R, or MFI depending on whether you prefer price-only or volume-weighted analysis
Volume analysis through Volume %, Volume Trend, or MFI to confirm price movements with corresponding volume characteristics
Volatility monitoring using ATR Percentile or Volatility Rank to identify expansion/contraction cycles and adjust position sizing
Trend vs range identification by comparing Trend Strength (high values = trending) against Choppiness Index (high values = ranging)
Statistical over-extension detection using CCI or Price Distance to identify when price has deviated significantly from normal behavior
Multi-timeframe analysis by duplicating the gauge on different timeframe charts to compare metric readings across time horizons
Educational purposes for new traders learning to interpret technical indicators through consistent visual representation
⚠️ Limitations
The gauge displays only one metric at a time, requiring manual switching to compare different indicators rather than simultaneous multi-metric viewing
The 0-100 normalization, while providing consistency, may obscure the raw values and specific nuances of each underlying indicator
Table-based visualization cannot be exported or saved as an image separately from the full chart screenshot
Optimal parameter settings vary by asset type, timeframe, and market conditions, requiring user experimentation for best results
💡 What Makes This Unique
Unified Multi-Metric Interface: The only gauge-style indicator offering 13 distinct metrics through a single interface, eliminating the need for multiple oscillator panels
Non-Overlapping Analytics: Each metric provides genuinely unique insights—MFI combines volume with price, CCI measures statistical deviation, Volatility Rank uses extended lookback, Trend Strength quantifies directional movement, and Choppiness Index measures ranging behavior
Universal Normalization System: All metrics standardized to 0-100 scale using indicator-appropriate algorithms that preserve statistical meaning while enabling consistent visual interpretation
Professional Visual Design: Semi-circular gauge with 21 arc segments, precision needle positioning, color-coded zones, and clean table implementation that maintains clarity across all chart configurations
Extensive Customization: Independent parameter controls for each metric, five position options, three size presets, and full color customization for seamless workspace integration
🔬 How It Works
1. Metric Calculation Phase:
All 13 metrics are calculated simultaneously on every bar using their respective algorithms with user-defined parameters
Each metric applies its own specific calculation method—RSI uses average gains vs losses, Stochastic compares close to high-low range, MFI incorporates typical price and volume, CCI measures deviation from statistical mean, ATR calculates true range, directional indicators measure up/down movement, and statistical metrics analyze price relationships
2. Normalization Process:
Each calculated metric is converted to a standardized 0-100 scale using indicator-appropriate transformations
Some metrics are naturally 0-100 (RSI, Stochastic, MFI, Williams %R), while others require scaling—CCI transforms from ±200 range, Momentum centers around 50, Volume ratio caps at 2x for 100, ATR and Volatility Rank calculate percentile positions, and Price Distance scales by standard deviations
3. Gauge Rendering:
The selected metric’s normalized value determines the needle position across 21 arc segments spanning 0-100
Each arc segment receives its color based on position—segments 0-8 are green zone, segments 9-14 are yellow zone, segments 15-20 are red zone
The needle indicator (▼) appears in row 5 at the column corresponding to the current metric value, providing precise visual feedback
4. Table Construction:
The gauge uses TradingView’s table system with merged cells for title and value display, ensuring consistent positioning regardless of chart configuration
Rows are allocated as follows: Row 0 merged for title, Row 1 merged for large value display, Row 2 for spacing, Rows 3-4 for the semi-circular arc with curved shaping, Row 5 for needle indicator, Row 6 for scale markers, Row 7 for numerical labels at 0/25/50/75/100
All visual elements update on every bar when barstate.islast is true, ensuring real-time accuracy without performance impact
💡 Note:
This indicator is designed for visual analysis and market condition assessment, not as a standalone trading system. For best results, combine gauge readings with price action analysis, support and resistance levels, and broader market context. Parameter optimization is recommended based on your specific trading timeframe and asset class. The gauge works on all timeframes but may require different parameter settings for intraday versus daily/weekly analysis. Consider using multiple instances of the gauge set to different metrics for comprehensive market analysis without switching between settings.

BB + OBV + RSI Strategy (Enhanced + Daily Table) Script Brief – *BB + OBV + RSI Strategy (Enhanced + Daily Table)*
This TradingView Pine Script combines **Bollinger Bands (BB)**, **On-Balance Volume (OBV)**, **Relative Strength Index (RSI)**, and **Exponential Moving Average (EMA)** to help traders identify potential trend conditions and market strength.
**Key Features:**
* **Bollinger Bands** (20-period SMA ± 2 Std Dev by default) to track volatility and price extremes.
* **OBV & OBV Moving Average** to confirm buying or selling pressure.
* **RSI** to highlight overbought and oversold zones.
* **200 EMA** as a long-term trend filter.
* **Daily Comparison Table** (top-right corner):
* Displays today’s vs. yesterday’s values for Close, RSI, OBV vs MA, BB Position, and EMA Trend.
* Helps quickly assess whether momentum and trend conditions are strengthening or weakening.
**Usage:**
* The chart shows **BB lines and EMA** for real-time analysis on any timeframe.
* The **table provides higher-timeframe context** (daily values), making it easier to confirm signals across multiple timeframes.
* Best applied with backtesting and proper risk management.

RSI ADX Bollinger Analysis High-level purpose and design philosophy
This indicator — RSI-ADX-Bollinger Analysis — is a compact, educational market-analysis toolkit that blends momentum (RSI), trend strength (ADX), volatility structure (Bollinger Bands) and simple volumetrics to provide traders a snapshot of market condition and trade idea quality. The design philosophy is explicit and layered: use each component to answer a different question about price action (momentum, conviction, volatility, participation), then combine answers to form a more robust, explainable signal. The mashup is intended for analysis and learning, not automatic execution: it surfaces the why behind signals so traders can test, learn and apply rules with risk management.
________________________________________
What each indicator contributes (component-by-component)
RSI (Relative Strength Index) — role and behavior: RSI measures short-term momentum by comparing recent gains to recent losses. A high RSI (near or above the overbought threshold) indicates strong recent buying pressure and potential exhaustion if price is extended. A low RSI (near or below the oversold threshold) indicates strong recent selling pressure and potential exhaustion or a value area for mean-reversion. In this dashboard RSI is used as the primary momentum trigger: it helps identify whether price is locally over-extended on the buy or sell side.
ADX (Average Directional Index) — role and behavior: ADX measures trend strength independently of direction. When ADX rises above a chosen threshold (e.g., 25), it signals that the market is trending with conviction; ADX below the threshold suggests range or weak trend. Because patterns and momentum signals perform differently in trending vs. ranging markets, ADX is used here as a filter: only when ADX indicates sufficient directional strength does the system treat RSI+BB breakouts as meaningful trade candidates.
Bollinger Bands — role and behavior: Bollinger Bands (20-period basis ± N standard deviations) show volatility envelope and relative price position vs. a volatility-adjusted mean. Price outside the upper band suggests pronounced extension relative to recent volatility; price outside the lower band suggests extended weakness. A band expansion (increasing width) signals volatility breakout potential; contraction signals range-bound conditions and potential squeeze. In this dashboard, Bollinger Bands provide the volatility/structural context: RSI extremes plus price beyond the band imply a stronger, volatility-backed move.
Volume split & basic MA trend — role and behavior: Buy-like and sell-like volume (simple heuristic using close>open or closeopen) or sell-like (close1.2 for validation and compare win rate and expectancy.
4. TF alignment: Accept signals only when higher timeframe (e.g., 4h) trend agrees — compare results.
5. Parameter sensitivity: Vary RSI threshold (70/30 vs 80/20), Bollinger stddev (2 vs 2.5), and ADX threshold (25 vs 30) and measure stability of results.
These exercises teach both statistical thinking and the specific failure modes of the mashup.
________________________________________
Limitations, failure modes and caveats (explicit & teachable)
• ADX and Bollinger measures lag during fast-moving news events — signals can be late or wrong during earnings, macro shocks, or illiquid sessions.
• Volume classification by open/close is a heuristic; it does not equal TAPEDATA, footprint or signed volume. Use it as supportive evidence, not definitive proof.
• RSI can remain overbought or oversold for extended stretches in persistent trends — relying solely on RSI extremes without ADX or BB context invites large drawdowns.
• Small-cap or low-liquidity instruments yield noisy band behavior and unreliable volume ratios.
Being explicit about these limitations is a strong point in a TradingView description — it demonstrates transparency and educational intent.
________________________________________
Originality & mashup justification (text you can paste)
This script intentionally combines classical momentum (RSI), volatility envelope (Bollinger Bands) and trend-strength (ADX) because each indicator answers a different and complementary question: RSI answers is price locally extreme?, Bollinger answers is price outside normal volatility?, and ADX answers is the market moving with conviction?. Volume participation then acts as a practical check for real market involvement. This combination is not a simple “indicator mashup”; it is a designed ensemble where each element reduces the others’ failure modes and together produce a teachable, testable signal framework. The script’s purpose is educational and analytical — to show traders how to interpret the interplay of momentum, volatility, and trend strength.
________________________________________
TradingView publication guidance & compliance checklist
To satisfy TradingView rules about mashups and descriptions, include the following items in your script description (without exposing source code):
1. Purpose statement: One or two lines describing the script’s objective (educational multi-indicator market overview and idea filter).
2. Component list: Name the major modules (RSI, Bollinger Bands, ADX, volume heuristic, SMA trend checks, signal tracking) and one-sentence reason for each.
3. How they interact: A succinct non-code explanation: “RSI finds momentum extremes; Bollinger confirms volatility expansion; ADX confirms trend strength; all three must align for a BUY/SELL.”
4. Inputs: List adjustable inputs (RSI length and thresholds, BB length & stddev, ADX threshold & smoothing, volume MA, table position/size).
5. Usage instructions: Short workflow (check TF alignment → confirm participation → define stop & R:R → backtest).
6. Limitations & assumptions: Explicitly state volume is approximated, ADX has lag, and avoid promising guaranteed profits.
7. Non-promotional language: No external contact info, ads, claims of exclusivity or guaranteed outcomes.
8. Trademark clause: If you used trademark symbols, remove or provide registration proof.
9. Risk disclaimer: Add the copy-ready disclaimer below.
This matches TradingView’s request for meaningful descriptions that explain originality and inter-component reasoning.
________________________________________
Copy-ready short publication description (paste into TradingView)
Advanced RSI-ADX-Bollinger Market Overview — educational multi-indicator dashboard. This script combines RSI (momentum extremes), Bollinger Bands (volatility envelope and band expansion), ADX (trend strength), simple SMA trend bias and a basic buy/sell volume heuristic to surface high-quality idea candidates. Signals require alignment of momentum, volatility expansion and rising ADX; volume participation is displayed to support signal confidence. Inputs are configurable (RSI length/levels, BB length/stddev, ADX length/threshold, volume MA, display options). This tool is intended for analysis and learning — not for automated execution. Users should back test and apply robust risk management. Limitations: volume classification here is a heuristic (close>open), ADX and BB measures lag in fast news events, and results vary by instrument liquidity.
________________________________________
Copy-ready risk & misuse disclaimer (paste into description or help file)
This script is provided for educational and analytical purposes only and does not constitute financial or investment advice. It does not guarantee profits. Indicators are heuristics and may give false or late signals; always back test and paper-trade before using real capital. The author is not responsible for trading losses resulting from the use or misuse of this indicator. Use proper position sizing and risk controls.
________________________________________
Risk Disclaimer: This tool is provided for education and analysis only. It is not financial advice and does not guarantee returns. Users assume all risk for trades made based on this script. Back test thoroughly and use proper risk management.

[blackcat] L1 Value Trend IndicatorOVERVIEW
The L1 Value Trend Indicator is a sophisticated technical analysis tool designed for TradingView users seeking advanced market trend identification and trading signals. This comprehensive indicator combines multiple analytical techniques to provide traders with a holistic view of market dynamics, helping identify potential entry and exit points through various signal mechanisms. 📈 It features a main Value Trend line along with a lagged version, golden cross and dead cross signals, and multiple technical indicators including RSI, Williams %R, Stochastic %K/D, and Relative Strength calculations. The indicator also includes reference levels for support and resistance analysis, making it a versatile tool for both short-term and long-term trading strategies. ✅
FEATURES
📈 Primary Value Trend Line: Calculates a smoothed value trend using a combination of SMA and custom smoothing techniques
🔍 Value Trend Lag: Implements a lagged version of the main trend line for cross-over analysis
🚀 Golden Cross & Dead Cross Signals: Identifies buy/sell opportunities when the main trend line crosses its lagged version
💸 Multi-Indicator Integration: Combines multiple technical analysis tools for comprehensive market view
📊 RSI Calculations: Includes 6-period, 7-period, and 13-period RSI calculations for momentum analysis
📈 Williams %R: Provides overbought/oversold conditions using the Williams %R formula
📉 Stochastic Oscillator: Implements both Stochastic %K and %D calculations for momentum confirmation
📋 Relative Strength: Calculates relative strength based on highest highs and current price
✅ Visual Labels: Displays BUY and SELL labels on chart when crossover conditions are met
📣 Alert Conditions: Provides automated alert conditions for golden cross and dead cross events
📌 Reference Levels: Plots entry (25) and exit (75) reference lines for support/resistance analysis
HOW TO USE
Copy the Script: Copy the complete Pine Script code from the original file
Open TradingView: Navigate to TradingView website or application
Access Pine Editor: Go to the Pine Script editor (usually found in the chart toolbar)
Paste Code: Paste the copied script into the editor
Save Script: Save the script with a descriptive name like " L1 Value Trend Indicator"
Select Chart: Choose the chart where you want to apply the indicator
Add Indicator: Apply the indicator to your chart
Configure Parameters: Adjust input parameters to customize behavior
Monitor Signals: Watch for golden cross (BUY) and dead cross (SELL) signals
Use Reference Levels: Monitor entry (25) and exit (75) lines for support/resistance levels
LIMITATIONS
⚠️ Potential Repainting: The script may repaint due to lookahead bias in some calculations
📉 Lookahead Bias: Some calculations may reference future values, potentially causing repainting issues
🔄 Parameter Sensitivity: Results may vary significantly with different parameter settings
📉 Computational Complexity: May impact chart performance with heavy calculations on large datasets
📊 Resource Usage: Requires significant processing power for multiple indicator calculations
🔄 Data Sensitivity: Results may be affected by data quality and market conditions
NOTES
📈 Signal Timing: Cross-over signals may lag behind actual price movements
📉 Parameter Optimization: Optimal parameters may vary by market conditions and asset type
📋 Market Conditions: Performance may vary significantly across different market environments
📈 Multi-Indicator: Combine signals with other technical indicators for confirmation
📉 Timeframe Analysis: Use multiple timeframes for enhanced signal accuracy
📋 Volume Analysis: Incorporate volume data for additional confirmation
📈 Strategy Integration: Consider using this indicator as part of a broader trading strategy
📉 Risk Management: Use signals as part of a comprehensive risk management approach
📋 Backtesting: Test parameter combinations with historical data before live trading
THANKS
🙏 Original Creator: blackcat1402 creates the L1 Value Trend Indicator
📚 Community Contributions: Recognition to TradingView community for continuous improvements and contributions
📈 Collaborative Development: Appreciation for collaborative efforts in enhancing technical analysis tools
📉 TradingView Community: Special thanks to TradingView community members for their ongoing support and feedback
📋 Educational Resources: Recognition of educational resources that helped in understanding technical analysis principles

Smart Trend Lines [The_lurker]
Smart Trend Lines
A multi-level trend classifier that detects bullish and bearish conditions using a methodology based on drawing trend lines—main, intermediate, and short-term—by identifying peaks and troughs. The tool highlights trend strength by applying filters such as the Average Directional Index (ADX) (A), Relative Strength Index (RSI) (R), and Volume (V), making it easier to interpret trend strength. The filter markers (V, A, R) in the Smart Trend Lines indicator are powerful tools for assessing the reliability of breakouts. Breakouts containing are the most reliable, as they indicate strong volume support, trend strength, and favorable momentum. Breakouts with partial filters (such as or ) require additional confirmation, while breakouts without filters ( ) should be avoided unless supported by other strong signals. By understanding the meaning of each filter and the market context.
Core Functionality
1. Trend Line Types
The indicator generates three distinct trend line categories, each serving a specific analytical purpose:
Main Trend Lines: These are long-term trend lines designed to capture significant market trends. They are calculated based on pivot points over a user-defined period (default: 50 bars). Main trend lines are ideal for identifying macro-level support and resistance zones.
Mid Trend Lines: These are medium-term trend lines (default: 21 bars) that focus on intermediate price movements. They provide a balance between short-term fluctuations and long-term trends, suitable for swing trading strategies.
Short Trend Lines: These are short-term trend lines (default: 9 bars) that track rapid price changes. They are particularly useful for scalping or day trading, highlighting immediate support and resistance levels.
Each trend line type can be independently enabled or disabled, allowing traders to tailor the indicator to their preferred timeframes.
2. Breakout Detection
The indicator employs a robust breakout detection system that identifies when the price crosses a trend line, signaling a potential trend reversal or continuation. Breakouts are validated using the following filters:
ADX Filter: The Average Directional Index (ADX) measures trend strength. A user-defined threshold (default: 20) ensures that breakouts occur during strong trends, reducing false signals in range-bound markets.
RSI Filter: The Relative Strength Index (RSI) identifies overbought or oversold conditions. Breakouts are filtered based on RSI thresholds (default: 65 for overbought, 35 for oversold) to avoid signals in extreme market conditions.
Volume Filter: Breakouts are confirmed only when trading volume exceeds a moving average (default: 20 bars) and aligns with the breakout direction (e.g., higher volume on bullish breakouts when the candle closes higher).
Breakout events are marked with labels on the chart, indicating the type of trend line broken (Main, Mid, or Short) and the filters satisfied (Volume, ADX, RSI). Alerts are triggered for each breakout, providing real-time notifications.
3. Customization Options
The indicator offers extensive customization through input settings, organized into logical groups for ease of use:
Main Trend Line Settings
Length: Defines the number of bars used to calculate pivot points (default: 50).
Bullish Color: Color for upward-sloping (bullish) main trend lines (default: green).
Bearish Color: Color for downward-sloping (bearish) main trend lines (default: red).
Style: Line style options include solid, dashed, or dotted (default: solid).
Mid Trend Line Settings
Length: Number of bars for mid-term pivot points (default: 21).
Show/Hide: Toggle visibility of mid trend lines (default: enabled).
Bullish Color: Color for bullish mid trend lines (default: lime).
Bearish Color: Color for bearish mid trend lines (default: maroon).
Style: Line style (default: dashed).
Short Trend Line Settings
Length: Number of bars for short-term pivot points (default: 9).
Show/Hide: Toggle visibility of short trend lines (default: enabled).
Bullish Color: Color for bullish short trend lines (default: teal).
Bearish Color: Color for bearish short trend lines (default: purple).
Style: Line style (default: dotted).
General Display Settings
Break Check Price: Selects the price type for breakout detection (Close, High, or Low; default: Close).
Show Previous Trendlines: Option to display historical main trend lines (default: disabled).
Label Size: Size of breakout labels (Tiny, Small, Normal, Large, Huge; default: Small).
Filter Settings
ADX Threshold: Minimum ADX value for trend strength confirmation (default: 25).
Volume MA Period: Period for the volume moving average (default: 20).
RSI Filter: Enable/disable RSI filtering (default: enabled).
RSI Upper Threshold: Upper RSI limit for overbought conditions (default: 65).
RSI Lower Threshold: Lower RSI limit for oversold conditions (default: 35).
4. Technical Calculations
The indicator relies on several technical calculations to ensure accuracy:
Pivot Points: Pivot highs and lows are detected using the ta.pivothigh and ta.pivotlow functions, with separate lengths for Main, Mid, and Short trend lines.
Slope Calculation: The slope of each trend line is calculated as the change in price divided by the change in bar index between two pivot points.
ADX Calculation: ADX is computed using a 14-period Directional Movement Index (DMI), with smoothing over 14 bars.
RSI Calculation: RSI is calculated over a 14-period lookback using the ta.rsi function.
Volume Moving Average: A simple moving average (SMA) of volume is used to determine if current volume exceeds the average.
5. Strict Mode Validation
To ensure the reliability of trend lines, the indicator employs a strict mode check:
For bearish trend lines, all prices between pivot points must remain below the projected trend line.
For bullish trend lines, all prices must remain above the projected trend line.
Post-pivot break checks ensure that no breakouts occur between pivot points, enhancing the validity of the trend line.
6. Trend Line Extension
Trend lines are dynamically extended forward until a breakout occurs. The extension logic:
Projects the trend line using the calculated slope.
Continuously validates the extension using strict mode checks.
Stops extension upon a breakout, fixing the trend line at the breakout point.
7. Alerts and Labels
Labels: Breakout labels are placed above (for bearish breakouts) or below (for bullish breakouts) the price bar. Labels include:
A prefix indicating the trend line type (B for Main, M for Mid, S for Short).
A suffix showing satisfied filters (e.g., for Volume, ADX, and RSI).
Alerts: Each breakout triggers a one-time alert per bar close, with a descriptive message indicating the trend line type and filters met.
Detailed Code Breakdown
1. Initialization and Inputs
The script begins by defining the indicator with indicator('Smart Trend Lines ', overlay = true), ensuring it overlays on the price chart. Input settings are grouped into categories (Main, Mid, Short, General Display, Filters) for user convenience. Each input includes a tooltip in both English and Arabic, enhancing accessibility.
2. Technical Indicator Calculations
Volume MA: Calculated using ta.sma(volume, volPeriod) to compare current volume against the average.
ADX: Computed using custom dirmov and adx functions, which calculate the Directional Movement Index and smooth it over 14 periods.
RSI: Calculated with ta.rsi(close, rsiPeriod) over 14 periods.
Price Selection: The priceToCheck function selects the price type (Close, High, or Low) for breakout detection.
3. Pivot Detection
Pivot points are detected using ta.pivothigh and ta.pivotlow for each trend line type. The lookback period is set to the respective trend line length (e.g., 50 for Main, 21 for Mid, 9 for Short).
4. Trend Line Logic
For each trend line type (Main, Mid, Short):
Bearish Trend Lines: Identified when two consecutive pivot highs form a downward slope. The script validates the trend line using strict mode and post-pivot break checks.
Bullish Trend Lines: Identified when two consecutive pivot lows form an upward slope, with similar validation.
Trend lines are drawn using line.new, with separate lines for the initial segment (between pivots) and the extended segment (from the second pivot forward).
5. Breakout Detection and Labeling
Breakouts are detected when the selected price crosses the trend line level. The script checks:
Volume conditions (above average and aligned with candle direction).
ADX condition (above threshold).
RSI condition (within thresholds if enabled). Labels are created with label.new, and alerts are triggered with alert.
6. Trend Line Extension
The extendTrendline function dynamically updates the trend line’s endpoint unless a breakout occurs. It uses strict mode checks to ensure the trend line remains valid.
7. Previous Trend Lines
If enabled, previous main trend lines are stored in arrays (previousBearishStartLines, previousBullishTrendLines, etc.) and displayed on the chart, providing historical context.
Disclaimer:
The information and publications are not intended to be, nor do they constitute, financial, investment, trading, or other types of advice or recommendations provided or endorsed by TradingView.

Range Filter Buy and Sell 5min## **Enhanced Range Filter Strategy: A Comprehensive Overview**
### **1. Introduction**
The **Enhanced Range Filter Strategy** is a powerful technical trading system designed to identify high-probability trading opportunities while filtering out market noise. It utilizes **range-based trend filtering**, **momentum confirmation**, and **volatility-based risk management** to generate precise entry and exit signals. This strategy is particularly useful for traders who aim to capitalize on trend-following setups while avoiding choppy, ranging market conditions.
---
### **2. Key Components of the Strategy**
#### **A. Range Filter (Trend Determination)**
- The **Range Filter** smooths price fluctuations and helps identify clear trends.
- It calculates an **adjusted price range** based on a **sampling period** and a **multiplier**, ensuring a dynamic trend-following approach.
- **Uptrends:** When the current price is above the range filter and the trend is strengthening.
- **Downtrends:** When the price falls below the range filter and momentum confirms the move.
#### **B. RSI (Relative Strength Index) as Momentum Confirmation**
- RSI is used to **filter out weak trades** and prevent entries during overbought/oversold conditions.
- **Buy Signals:** RSI is above a certain threshold (e.g., 50) in an uptrend.
- **Sell Signals:** RSI is below a certain threshold (e.g., 50) in a downtrend.
#### **C. ADX (Average Directional Index) for Trend Strength Confirmation**
- ADX ensures that trades are only taken when the trend has **sufficient strength**.
- Avoids trading in low-volatility, ranging markets.
- **Threshold (e.g., 25):** Only trade when ADX is above this value, indicating a strong trend.
#### **D. ATR (Average True Range) for Risk Management**
- **Stop Loss (SL):** Placed **one ATR below** (for long trades) or **one ATR above** (for short trades).
- **Take Profit (TP):** Set at a **3:1 reward-to-risk ratio**, using ATR to determine realistic price targets.
- Ensures volatility-adjusted risk management.
---
### **3. Entry and Exit Conditions**
#### **📈 Buy (Long) Entry Conditions:**
1. **Price is above the Range Filter** → Indicates an uptrend.
2. **Upward trend strength is positive** (confirmed via trend counter).
3. **RSI is above the buy threshold** (e.g., 50, to confirm momentum).
4. **ADX confirms trend strength** (e.g., above 25).
5. **Volatility is supportive** (using ATR analysis).
#### **📉 Sell (Short) Entry Conditions:**
1. **Price is below the Range Filter** → Indicates a downtrend.
2. **Downward trend strength is positive** (confirmed via trend counter).
3. **RSI is below the sell threshold** (e.g., 50, to confirm momentum).
4. **ADX confirms trend strength** (e.g., above 25).
5. **Volatility is supportive** (using ATR analysis).
#### **🚪 Exit Conditions:**
- **Stop Loss (SL):**
- **Long Trades:** 1 ATR below entry price.
- **Short Trades:** 1 ATR above entry price.
- **Take Profit (TP):**
- Set at **3x the risk distance** to achieve a favorable risk-reward ratio.
- **Ranging Market Exit:**
- If ADX falls below the threshold, indicating a weakening trend.
---
### **4. Visualization & Alerts**
- **Colored range filter line** changes based on trend direction.
- **Buy and Sell signals** appear as labels on the chart.
- **Stop Loss and Take Profit levels** are plotted as dashed lines.
- **Gray background highlights ranging markets** where trading is avoided.
- **Alerts trigger on Buy, Sell, and Ranging Market conditions** for automation.
---
### **5. Advantages of the Enhanced Range Filter Strategy**
✅ **Trend-Following with Noise Reduction** → Helps avoid false signals by filtering out weak trends.
✅ **Momentum Confirmation with RSI & ADX** → Ensures that only strong, valid trades are executed.
✅ **Volatility-Based Risk Management** → ATR ensures adaptive stop loss and take profit placements.
✅ **Works on Multiple Timeframes** → Effective for day trading, swing trading, and scalping.
✅ **Visually Intuitive** → Clearly displays trade signals, SL/TP levels, and trend conditions.
---
### **6. Who Should Use This Strategy?**
✔ **Trend Traders** who want to enter trades with momentum confirmation.
✔ **Swing Traders** looking for medium-term opportunities with a solid risk-reward ratio.
✔ **Scalpers** who need precise entries and exits to minimize false signals.
✔ **Algorithmic Traders** using alerts for automated execution.
---
### **7. Conclusion**
The **Enhanced Range Filter Strategy** is a powerful trading tool that combines **trend-following techniques, momentum indicators, and risk management** into a structured, rule-based system. By leveraging **Range Filters, RSI, ADX, and ATR**, traders can improve trade accuracy, manage risk effectively, and filter out unfavorable market conditions.
This strategy is **ideal for traders looking for a systematic, disciplined approach** to capturing trends while **avoiding market noise and false breakouts**. 🚀
